
Figures & data
Figure 1. The infiltrating features and proportion of each lymphocyte in CRC TCGA tissue samples. (A) The infiltrating levels of each lymphocyte in three CRC TCGA cohorts by TIMER 2.0. The vertical figure was drawn using Origin Pro Portable software. (B) Infiltration of immune cells calculated by two algorithms (CIBERSORT and CIBERSORT-ABS) of CRC was presented using TIMER 2.0. CIBERSORT group is marked blue, and CIBERSORT-ABS is marked red. Open circles represent mean value. Data were analyzed using Wilcoxon rank sum test. (C) The correlation map of the proportion of each immune cell in CRC samples calculated using CIBERSORT algorithms provided by TIMER 2.0. Red and blue colors indicate positive and negative correlations, respectively. Both multiple-panel bar plot (B) and corrplot (C) are demonstrated using Xiantao Academic (www.xiantao.love). (D-E) For the eight infiltrating lymphocyte cell types for which all six algorithms can calculate the abundance, a multi-panel bar plot and component proportions pie chart drawn using TIMER 2.0 show differences of their infiltration level estimated by different algorithms among five different TCGA tissue samples. CRC, Colorectal cancer; TCGA, The Cancer Genome Atlas; TIMER, Tumor Immune Estimation Resource; NK, natural killer.
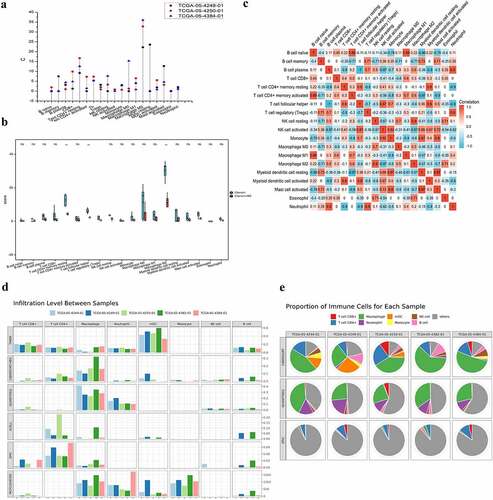
Figure 2. The infiltration level of major-lineage immune cells in CRC GSE sc-seq samples. In single cell level, four different GSE sc-seq samples of primary CRC tissues were analyzed to evaluate the proportion of each cell type used TISCH (a-d). GSE, Gene Expression Omnibus Series; CRC, Colorectal cancer; TISCH, The Cancer Immune Single-Cell Hub.
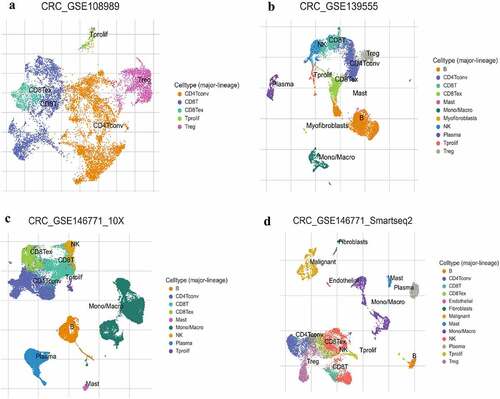
Figure 3. The distributions of immune infiltration levels under different gene mutation status.
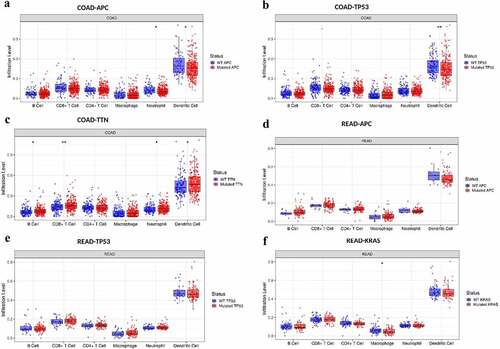
Figure 4. The comparison of tumor infiltration levels among tumors with different somatic copy number alterations for genes.
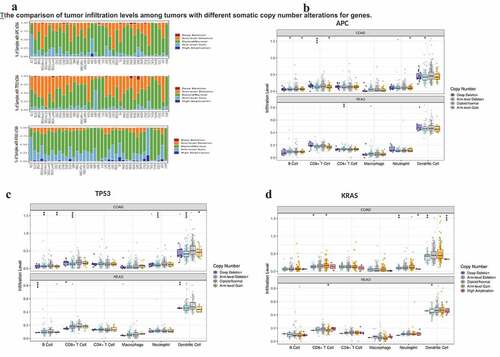
Figure 5. The survival difference of CRC TILs of each subset. To visualize the survival differences measured by TIMER 2.0, the Kaplan–Meier plots for immune infiltrates of CRC are shown in A-B. A: 12-month follow-up; B: 36-month follow-up. The median divides the infiltrating levels of each subset into two categories: low and high. each graphic displays the P-value of a log-rank test used to compare two groups’ survival curves.
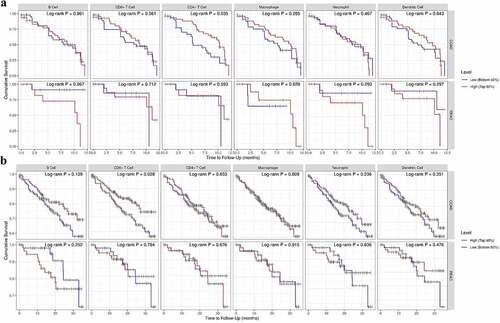
Table 1. The multivariate Cox proportional hazard analyses of the subsets of CRC TILs.
Table 2. The correlation analysis between age and each subsets of TILs of CRC.
Figure 6. Increasing age associated with better ICB responses. A: The distribution of various immune checkpoint genes’ expression in CRC tissues and healthy tissues was analyzed using ASSISTANT FOR clinical bioinformatics. different colors denote different groups of samples in the abscissa, while the ordinate shows the distribution of gene expression. Asterisks (*) indicate significance levels. *p < 0.05, **p < 0.01,***p < 0.001. The statistical difference of the two groups was compared using the Wilcox test. B-D: The association between different age groups and ICB responses was analyzed using ASSISTANT FOR Clinical Bioinformatics. The top graph shows the table of CRC sample immune response statistics among different groups in the prediction results, and the bottom graph shows the distribution of immune response scores among different groups in the prediction results. The TIDE algorithm was used to forecast potential ICB responses. The lower the TIDE value, the better the ICB response. The above graphical analysis was performed using the R (v4.0.3) package ggplot2 (v3.3.3) and ggpubr (0.4.0). (B: cutoff at 50 years, i.e. Group 1 for CRC patients younger than 50 years and Group 2 for CRC patients older than 50 years; C: cutoff at 60 years for CRC patients; D: cutoff at 70 years for CRC patients.) E: The association between lymphocyte infiltration and good ICB response was explored using CRI iAtlas Portal in three different cohort studies using lymphocyte infiltration as a variable in melanoma samples [Citation46,Citation47] and glioblastoma samples (Prins 2019). F: In three different cohort studies, age was used as a variable to explore whether increasing age was associated with a better ICB response in melanoma and glioblastoma samples, which was analyzed by CRI iAtlas Portal.
![Figure 6. Increasing age associated with better ICB responses. A: The distribution of various immune checkpoint genes’ expression in CRC tissues and healthy tissues was analyzed using ASSISTANT FOR clinical bioinformatics. different colors denote different groups of samples in the abscissa, while the ordinate shows the distribution of gene expression. Asterisks (*) indicate significance levels. *p < 0.05, **p < 0.01,***p < 0.001. The statistical difference of the two groups was compared using the Wilcox test. B-D: The association between different age groups and ICB responses was analyzed using ASSISTANT FOR Clinical Bioinformatics. The top graph shows the table of CRC sample immune response statistics among different groups in the prediction results, and the bottom graph shows the distribution of immune response scores among different groups in the prediction results. The TIDE algorithm was used to forecast potential ICB responses. The lower the TIDE value, the better the ICB response. The above graphical analysis was performed using the R (v4.0.3) package ggplot2 (v3.3.3) and ggpubr (0.4.0). (B: cutoff at 50 years, i.e. Group 1 for CRC patients younger than 50 years and Group 2 for CRC patients older than 50 years; C: cutoff at 60 years for CRC patients; D: cutoff at 70 years for CRC patients.) E: The association between lymphocyte infiltration and good ICB response was explored using CRI iAtlas Portal in three different cohort studies using lymphocyte infiltration as a variable in melanoma samples [Citation46,Citation47] and glioblastoma samples (Prins 2019). F: In three different cohort studies, age was used as a variable to explore whether increasing age was associated with a better ICB response in melanoma and glioblastoma samples, which was analyzed by CRI iAtlas Portal.](/cms/asset/d45d6226-785a-468d-9239-5929ee2e779b/kbie_a_2162660_f0006_oc.jpg)