
Figures & data
Figure 1. Quality evaluation of the included studies.
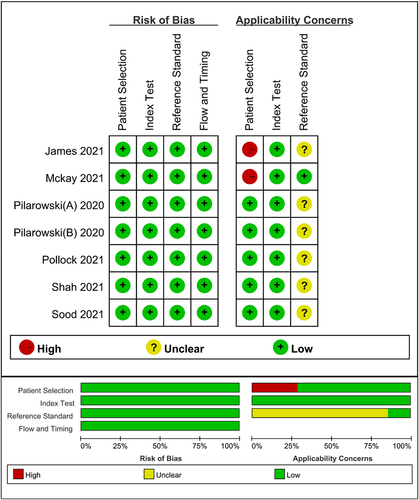
Figure 2. Forest plots for the combined sensitivity(a), specificity(b), positive LR(c), negative LR(d) of BinaxNOW.
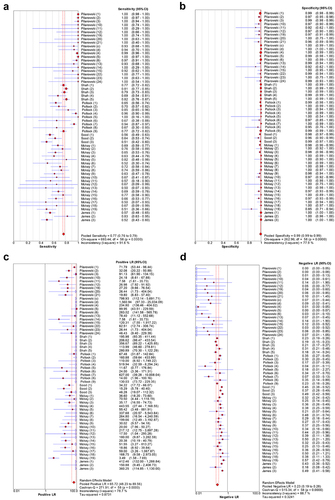
Figure 3. Forest plots for the combined diagnostic OR of BinaxNOW(a) and summary receiver operating characteristic curves of COVID-19 infections detected by BinaxNOW(b).
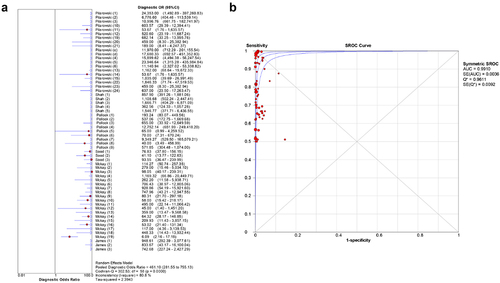
Table 1. Subgroup analyses for the exploration of factors influencing heterogeneity in the BinaxNOW assay.
Table 2. Weighted meta-regression to assess the effects of various factors on the diagnostic accuracy of the BinaxNOW assay.
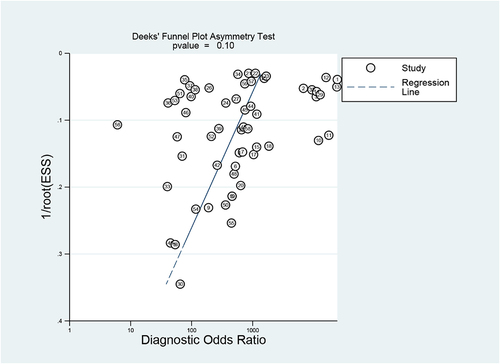
Figure 4. Deeks’ funnel plot asymmetry test to assess publication bias in estimates of diagnostic OR for BinaxNOW detection of COVID-19 infections.
Supplemental Material
Download Zip (844.7 KB)Data availability statement
All data generated or analyzed during this study are included in this published article.