
Figures & data
Table 1. Primers used to clone RIT variants.
Table 2. Plasmids for transient RIT expression in PCPs and differentiated plants. All pTrac vectors contain the double enhanced cauliflower mosaic virus 35S promoter (CaMV35SS). Both, the anti-CD64 and anti-CD89 scFv are humanized versions of antibodies originating from mice.
Table 3. Primary and secondary IgG antibodies used for the immunodetection of RITs.
Table 4. FITC-conjugated antibodies used to label AML-specific CD markers in flow cytometry.
Figure 1. High-throughput screening of RIT accumulation in PCPs for the identification of drug candidates. (a) RIT accumulation in different subcellular compartments. Fusions with N-terminal payload are plotted in light colors and with C-terminal payload in dark colors. Different letters indicate a significant difference for fusions with N-terminal payload (letter before slash) and C-terminal payload (letter after slash). (b) Impact of different scFv antibodies (anti-CD64 and anti-CD89) on the accumulation of RITs based on mCherry, VisA and ETA′ in PCPs. (c) Impact of the RIT orientation on the accumulation of RITs based on mCherry, VisA and ETA′ using the CHS 5′-UTR. Microscopic images of BY-2 cells from PCPs 4 days post-infiltration (dpi) with R. radiobacter carrying plasmids for the expression of mCherry-anti-CD64 (d), treated with harsh extraction buffer (em PCPs harvested 3 dpi (green data points) or 4 dpi (blue data points). Viability was assessed by microscopic analysis of cells after Evans blue staining. Negative controls were non-infiltrated PCPs and positive controls were treated with harsh extraction buffer [Citation28] for 20 min. PCPs were mock infiltrated with R. radiobacter carrying plasmids for the expression of mCherry-anti-CD64. N-terminal and C terminal VisA and ETA′ fusions were targeted to different compartments. Error bars represent standard deviations with n ≥ 4 and N = 456 (a), n ≥ 12 and N = 660 (b), n ≥ 12 and N = 161 (c) or n = 10 (h) biological replicates. Statistical testing was based on two-way ANOVA with Bonferroni correction at a significance level of α = 0.05.Samples with no significant differences are labeled with identical letters. Cyto, cytosol; Chlo, chloroplasts; Apo, apoplast; ER, endoplasmic reticulum.
![Figure 1. High-throughput screening of RIT accumulation in PCPs for the identification of drug candidates. (a) RIT accumulation in different subcellular compartments. Fusions with N-terminal payload are plotted in light colors and with C-terminal payload in dark colors. Different letters indicate a significant difference for fusions with N-terminal payload (letter before slash) and C-terminal payload (letter after slash). (b) Impact of different scFv antibodies (anti-CD64 and anti-CD89) on the accumulation of RITs based on mCherry, VisA and ETA′ in PCPs. (c) Impact of the RIT orientation on the accumulation of RITs based on mCherry, VisA and ETA′ using the CHS 5′-UTR. Microscopic images of BY-2 cells from PCPs 4 days post-infiltration (dpi) with R. radiobacter carrying plasmids for the expression of mCherry-anti-CD64 (d), treated with harsh extraction buffer (em PCPs harvested 3 dpi (green data points) or 4 dpi (blue data points). Viability was assessed by microscopic analysis of cells after Evans blue staining. Negative controls were non-infiltrated PCPs and positive controls were treated with harsh extraction buffer [Citation28] for 20 min. PCPs were mock infiltrated with R. radiobacter carrying plasmids for the expression of mCherry-anti-CD64. N-terminal and C terminal VisA and ETA′ fusions were targeted to different compartments. Error bars represent standard deviations with n ≥ 4 and N = 456 (a), n ≥ 12 and N = 660 (b), n ≥ 12 and N = 161 (c) or n = 10 (h) biological replicates. Statistical testing was based on two-way ANOVA with Bonferroni correction at a significance level of α = 0.05.Samples with no significant differences are labeled with identical letters. Cyto, cytosol; Chlo, chloroplasts; Apo, apoplast; ER, endoplasmic reticulum.](/cms/asset/08d7374a-bdd7-40e8-a112-4de3fd13a6ce/kbie_a_2244235_f0001_oc.jpg)
Figure 2. Optimization of PCP-based expression using VisA RITs targeted to the ER. (a) Response surface indicating the impact of incubation time and infiltration OD600 nm on the accumulation of the ER-targeted VisA-anti-CD64 RIT transiently expressed in PCPs. (b) Impact of incubation time and infiltration OD600 nm on the stability of the VisA-anti-CD64 RIT produced in PCPs. (c) Impact of incubation time and infiltration OD600 nm on the accumulation level of the anti-CD64-VisA RIT produced in PCPs. (d) Impact of incubation time and infiltration OD600 nm on the stability of the anti-CD64-VisA RIT produced in PCPs. (e) Impact of incubation time and infiltration OD600 nm on VisA-anti-CD64 accumulation in PCPs. Data were derived from the DoE (solid lines) and additional experiments (dashed lines). Error bars represent the standard deviation (n ≥ 3) with groups of significantly different means based on an α-level of 0.05 and two-way ANOVA (with Bonferroni correction) shown as letters. Dark and light red dots in a – d represent experimental data points above and below the model respectively and model quality parameters are given in Table S1.
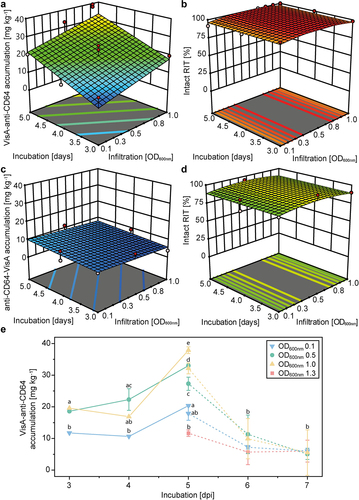
Figure 3. Scalability of RIT expression to differentiated plants and preparative PCPs (pPCPs). (a) Comparison of PCPs and differentiated N. benthamiana plants for the expression of RITs with different payloads. (b) Accumulation of ER-targeted N-terminal (red dots) and C-terminal (green dots) VisA-based RITs in differentiated N. benthamiana plants according to the incubation time after infiltration (4–6 days). Dotted lines represent 95% confidence intervals (CI) for the model with a fair fit (Table S2) using a natural log transformation. (c) Accumulation of RITs in N. benthamiana plants (different subcellular compartments) for different payloads conjugated to an anti-CD64 scFv. (d) Correlation of DsRed in differentiated N. benthamiana plants and pPCPs generated from a BY-2 culture volume of 10 mL with a cell density of 200 g L−1 (m v−1) and n ≥ 7 biological replicates (N = 24). Lines represent linear fits (Table S3). Error bars represent standard deviation with n ≥ 9 (a) or n ≥ 3 (c) and N = 554 (a) or N = 77 (c) biological replicates. In a and c, statistical significance was determined by two-way ANOVA with Bonferroni correction. Samples without significant differences are marked with identical letters. Apo, apoplast; Chlo, chloroplast; Cyto, cytosol; ER, endoplasmic reticulum; N.B., N. benthamiana.
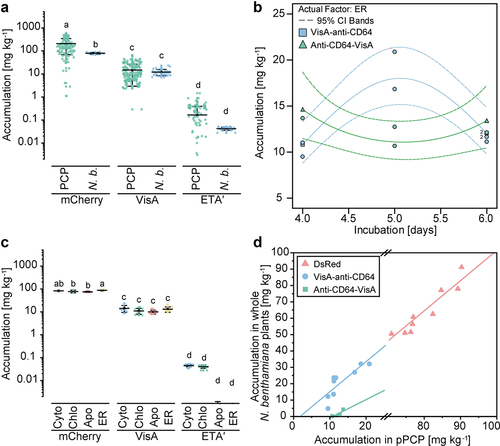
Table 5. Extraction, clarification and purification of VisA-anti-CD64 RIT and surrogate fusion protein from pPCPs and plants.
Figure 4. Downstream process development for scFv-based RITs produced in plants and pPCPs. (a) Response surface as a function of RIT recovery during a Capto L chromatography capture step using whole plant extracts containing mCherry-anti-CD64, showing dependence on elution buffer conductivity (5–25 mS cm−1) and elution buffer pH (2.0–3.0). The model had a good fit (Table S4). (b) Response surface as a function of RIT purity during a Capto L chromatography capture step using whole plant-derived extracts containing mCherry-anti-CD64, showing dependence on the wash buffer pH (4.0–8.0) and elution buffer pH (2.0–3.0). The model had a poor fit (Table S5). (c) LDS-PAGE and western blot analysis (gel and blot overlay) showing Protein L chromatography samples of VisA-anti-CD64 from whole plants or pPCPs using a two-step elution with pH 2.1 and 12.3. (d) Response surface as a function of VisA-anti-CD64 RIT recovery from pPCP extracts during a Protein L chromatography capture step, showing dependence on the elution buffer conductivity (40–100 mS cm−1) and elution buffer pH (2.0–3.0). The model had a good fit (Table S6). (e) LDS-PAGE and western blot analysis of pooled elution and buffer exchange samples of VisA-anti-CD64 purified from pPCPs by Protein L chromatography using a two-step elution with pH 2.1 and 12.3. Control, 25 mg L−1 VisA; marker, Pre-stained protein ladder; Hom, homogenate; Centr, centrifugation (supernatant); FT, flow through; W, wash; Elu, elution; TSP, total soluble protein; pPCP, preparative PCP.
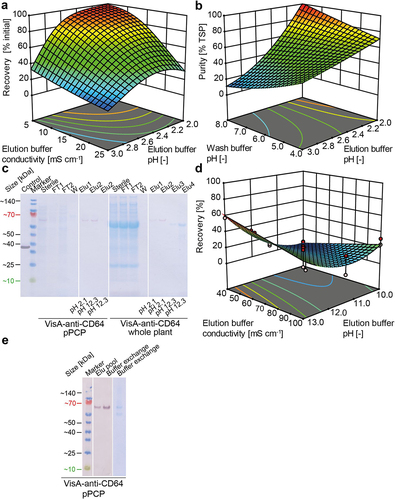
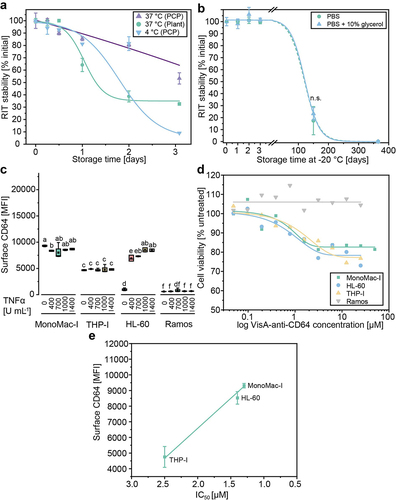
Figure 5. Evaluation of VisA-anti-CD64 stability and activity. (a) Stability of Protein L-purified VisA-anti-CD64 derived from N. benthamiana plants or BY-2 PCPs. Stability was tested at temperatures required for in vitro or in vivo activity studies (37°C) and short-term storage (4°C) based on western blot analysis (Table S5). (b) Long-term stability of purified, Ppcp-derived VisA-anti-CD64 stored at − 20°C in PBS with and without 10% (v v−1) glycerol based on western blot analysis. Measurement after 150 days with and without 10% (v v−1) glycerol were compared by Welch’s t-test (p = 0.35, α = 0.05). (c) Analysis of human AML cell lines and a CD64– control (Ramos) stimulated with TNFα for 24 h by flow cytometry. Data represent the mean fluorescence intensity (MFI) from the surface of 103 cells. Statistical significance (α = 0.05) was determined by ANOVA with Bonferroni correction. Samples without significant differences are marked with identical letters. (d) Viability of human AML cell lines treated with VisA-anti-CD64 RITs purified from PCPs based on a colorimetric XTT assay. Cells were stimulated with 1000 U mL−1 TNFα 24 h before treatment with 0.05–50 µM VisA-anti-CD64 and were incubated at 37°C in a 5% CO2 atmosphere. We used 150 mg L−1 puromycin as a positive control and PBS as a negative control. IC50 values were 1.3 µM for MonoMac-I, 1.4 µM for HL-60 and 2.5 µM for THP-I. (e) Correlation between CD64 surface presentation on human AML cell lines MonoMac-I, HL-60 and THP-I and relative IC50 values determined for VisA-antiCD64 RIT produced in pPCPs and purified using Protein L. Error bars represent standard deviation of n = 3 biological replicates. Lines represent fits using Boltzmann (a, b), dose response (d) or linear functions (e) (details in Table S5). IC50, half maximal inhibitory concentration; MFI, mean fluorescence intensity; n.S., not significant; PBS, phosphate-buffered saline; TNFα, tumor necrosis factor α.
Supplemental Material
Download PDF (1.1 MB)Data availability statement
The data that support the findings of this study are available from the corresponding author upon reasonable request.