Figures & data
Figure 1. Selection process of articles on the use of BC in the AD of organic waste published between 2011 and 2022.
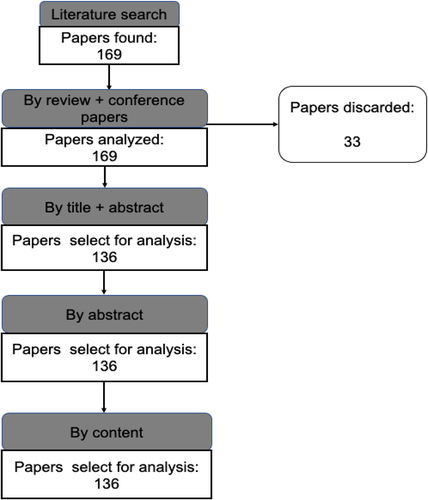
Figure 2. Global panorama of the application of BC in the AD of organic waste (n=136 studies).
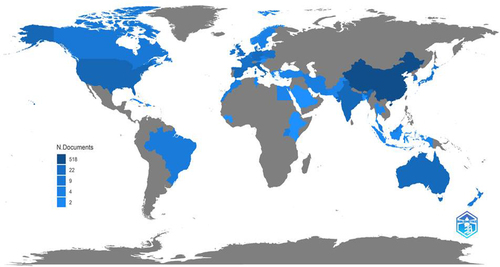
Figure 3. a) Thematic map and b) MCA related to the use of BC in the AD of organic waste.
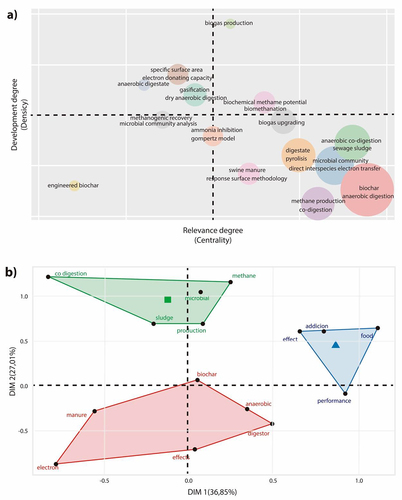
Figure 4. Evolution of BC application trends in areas associated with AD of organic waste between 2011 and 2022 (n=136).
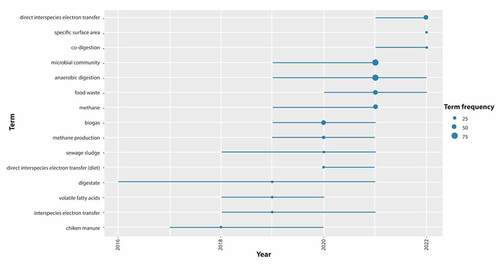
Figure 5. Hierarchical cluster analysis dendrogram associated with the connection between keywords.
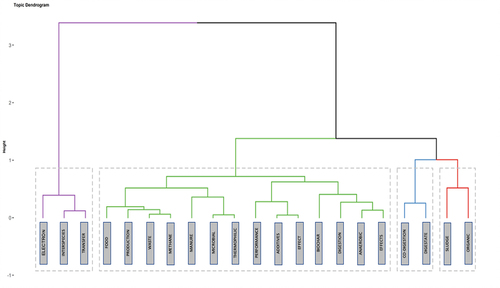
Table 1. Operational and environmental factors identified in the use of BC in the AD of organic waste.
Figure 6. Effect of BC type and substrate used during AD studies of organic residues: a) duration of lag-phase, b) percentage change of lag-phase, c) methane production by type of substrate, and d) percent change in methane production. The number of observations on each BC or substrate is shown in parentheses. Error bars indicate the confidence range of 95%.
Figure 7. Effect of BC type on AD monitoring variables of organic waste: a) behavior of pH, b) behavior of VFAs, c) methane production, and d) behavior of total ammonia nitrogen (TAN).