
Figures & data

Figure 1. (a) Germinated kenaf seedlings. (b) Callus grown on kenaf stem. (c) Axenic kenaf callus. (d,e) Kenaf callus in cell suspension culture. (f) Kenaf callus biomass. (g) Kenaf extracellular polysaccharide.
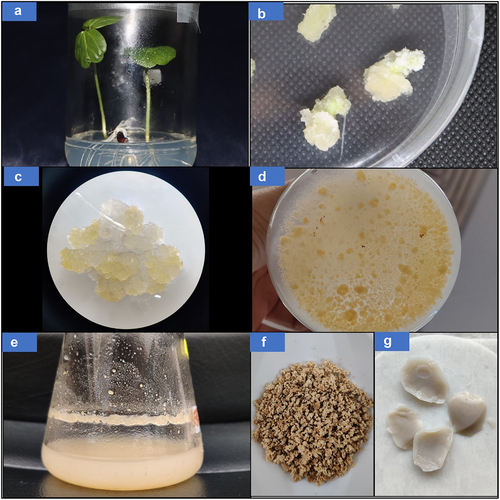
Table 1. Experimental range and levels of independent variables.
Figure 2. Growth curve of kenaf callus in cell suspension culture.
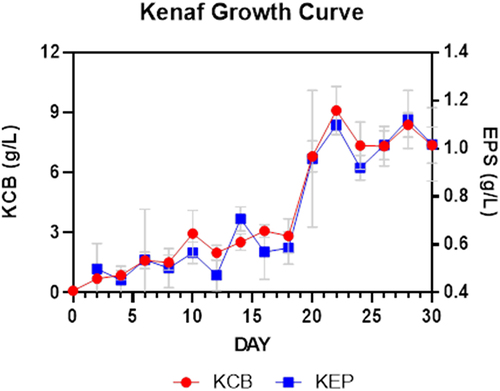
Table 2. RSM with CCD matrix and the outcomes of the KCB and EPS production.
Table 3. The results of analysis of variance (ANOVA) generated from the CCD quadratic model in RSM for KCB.
Figure 3. Three-dimensional (3D) response surface plot of KCB production of Hibiscus cannabinus showing the interaction between; (a) sucrose and agitation, (b) sucrose and NAA, (c) sucrose and 2,4-D, (d) agitation and NAA, (e) agitation and 2,4-D and (f) NAA and 2,4-D.
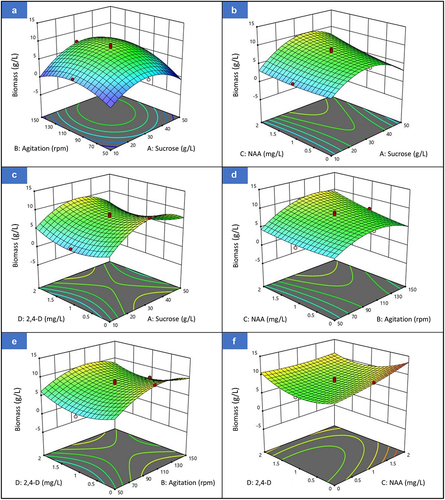
Table 4. The results of analysis of variance (ANOVA) generated from the CCD quadratic model in RSM for EPS.
Figure 4. Three-dimensional (3D) response surface plot of EPS production of Hibiscus cannabinus showing the interaction between; (a) sucrose and agitation, and (b) agitation and NAA.

Table 5. Optimized conditions for kenaf callus cell suspension culture.
Table 6. Kinetic parameters of kenaf callus in cell suspension culture.
Figure 5. FTIR spectra of EPS from kenaf callus in suspension culture.
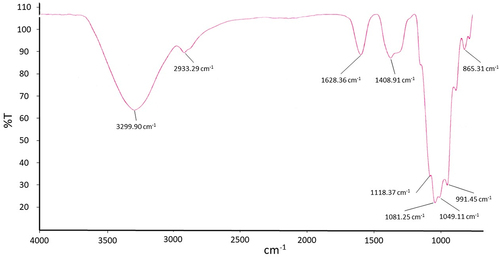
Table 7. Comparison of the total biomass and extracellular polysaccharide produced with other literature.
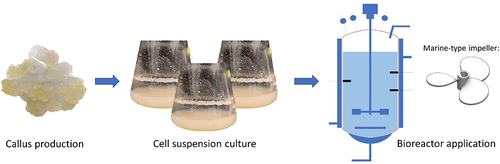
Figure 6. Possible workflow for the mass-production of kenaf KCB and EPS.
Data availability statement
The authors confirm that the data supporting the findings of this study are available within the article.