
Figures & data
Figure 1. Common methods of tissue-engineered trachea preparation. (a) casting, (b) decellularization, (c) electrospinning, and (d) 3D bioprinting. Images were generated using the Medpeer software.
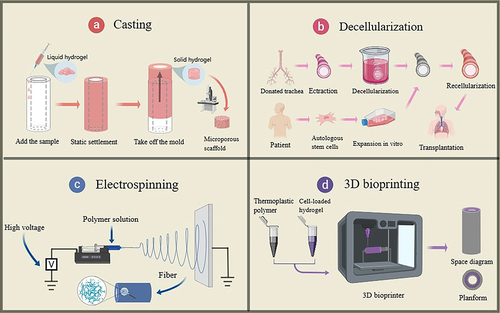
Figure 2. Literature search and screening process.
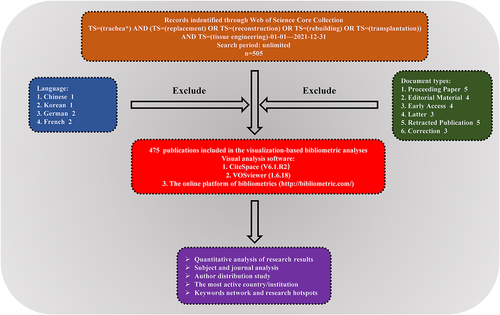
Figure 3. Annual publication volume analysis. (a, b) number of research publications per annum and growth trends for tissue-engineered trachea in general (a) and in the top 10 countries (b). The results were exported from the online analysis platform of literature metrology (http://bibliometric.com/). Blocks of different colors represent different countries.
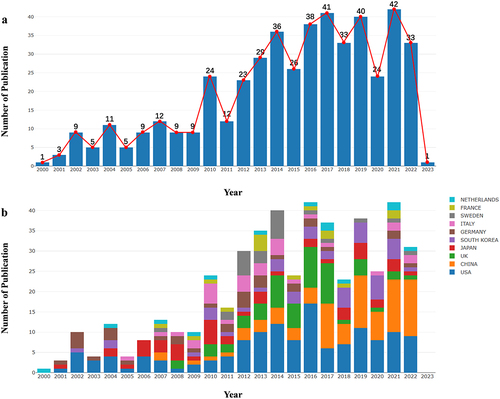
Figure 4. Subject distribution map and a dual-map overlay. (a) articles published in top 10 journals. Blocks of different colors represent different journals. (b) the dual-map overlay of journals that published articles on tissue-engineering trachea. Each small dot represents a journal, and different colors represent different clusters (cluster keyword: subject). The left area of the image represents the journals in which papers were published, the right area represents the cited journals, and the paths of different colors represent citation relationships between journals [Citation21]. There are four reference routes: two orange and two green paths.
![Figure 4. Subject distribution map and a dual-map overlay. (a) articles published in top 10 journals. Blocks of different colors represent different journals. (b) the dual-map overlay of journals that published articles on tissue-engineering trachea. Each small dot represents a journal, and different colors represent different clusters (cluster keyword: subject). The left area of the image represents the journals in which papers were published, the right area represents the cited journals, and the paths of different colors represent citation relationships between journals [Citation21]. There are four reference routes: two orange and two green paths.](/cms/asset/f53023e3-b22a-4be4-9a1b-78d64a87a790/kbie_a_2274150_f0004_oc.jpg)
Table 1. Top 10 journals in terms of the number of publications and co-citation frequency.
Figure 5. Research results and visualization of collaboration between different authors, countries, and institutions. (a) a circle represents an author, different colors represent different clusters, and lines between them represent partnerships. (b) a circle represents an author, different colors represent different years of research, darker colors are closer to the present, and lines between them represent collaborations. (c) a circle represents a country, the size of the circle is proportional to the number of publications, and the lines between circles represent partnerships. (d) a circle represents an institution, the size of the circle is proportional to the number of publications, and the lines between them represent partnerships. The thickness of the lines represents the closeness of cooperation between countries and institutions [Citation22,Citation23].
![Figure 5. Research results and visualization of collaboration between different authors, countries, and institutions. (a) a circle represents an author, different colors represent different clusters, and lines between them represent partnerships. (b) a circle represents an author, different colors represent different years of research, darker colors are closer to the present, and lines between them represent collaborations. (c) a circle represents a country, the size of the circle is proportional to the number of publications, and the lines between circles represent partnerships. (d) a circle represents an institution, the size of the circle is proportional to the number of publications, and the lines between them represent partnerships. The thickness of the lines represents the closeness of cooperation between countries and institutions [Citation22,Citation23].](/cms/asset/7c6d9f73-1230-4a43-b26a-35cb7003b228/kbie_a_2274150_f0005_oc.jpg)
Table 2. Top 10 authors in terms of the number of publications.
Figure 6. A padded map of the number of publications in different countries.
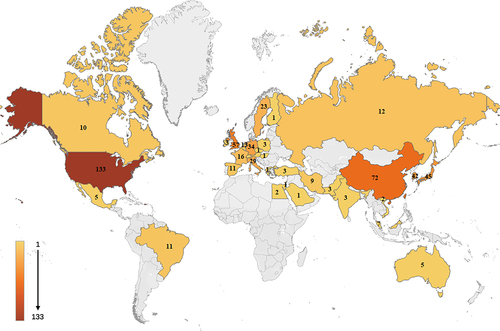
Figure 7. Visualization of keywords and emergent words. (a, b) a node represents a keyword, and the size of the node is proportional to the number of times the keyword was used. The line between two nodes indicates that the two nodes appeared in the same article. Different colors represent different keyword clusters (a) or different years in which the keyword was used (b). (c) the top 25 breakout words. The dark blue line represents the year of the first occurrence, and the red line represents the duration of the eruption.
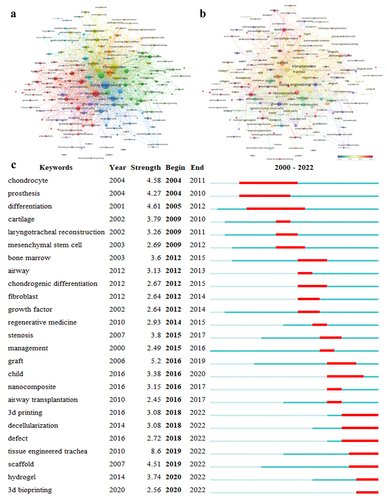
Table 3. Top 10 most frequent keywords.
Figure 8. Cell biology of tissue-engineered trachea and tracheal scaffold construction. (a) schematic diagram of targeted differentiation of airway epithelial cells from human induced pluripotent stem cells and staining for immunomarkers indicating xenografted epithelium. Adapted with permission from [Citation45], copyright 2021, Elsevier Ltd. (b) Microscopic immunohistochemical staining of neonatal chondrocytes and neovascularization from bone marrow mesenchymal stem cells. Adapted with permission from [Citation46], copyright 2018, MDPI. (c) a trachea-mimetic cellular construct of a clinically relevant size based on the advanced extruded 3D bio-printing technology. Adapted with permission from [Citation47], copyright 2021, Elsevier Ltd. (d) bacteriostatic characterization of 3D bioprinted scaffolds constructed based on gelatin methacrylamide mixed with novel superparamagnetic oxidation nanoparticles. Adapted with permission from [Citation48], copyright 2022, Elsevier Ltd.
![Figure 8. Cell biology of tissue-engineered trachea and tracheal scaffold construction. (a) schematic diagram of targeted differentiation of airway epithelial cells from human induced pluripotent stem cells and staining for immunomarkers indicating xenografted epithelium. Adapted with permission from [Citation45], copyright 2021, Elsevier Ltd. (b) Microscopic immunohistochemical staining of neonatal chondrocytes and neovascularization from bone marrow mesenchymal stem cells. Adapted with permission from [Citation46], copyright 2018, MDPI. (c) a trachea-mimetic cellular construct of a clinically relevant size based on the advanced extruded 3D bio-printing technology. Adapted with permission from [Citation47], copyright 2021, Elsevier Ltd. (d) bacteriostatic characterization of 3D bioprinted scaffolds constructed based on gelatin methacrylamide mixed with novel superparamagnetic oxidation nanoparticles. Adapted with permission from [Citation48], copyright 2022, Elsevier Ltd.](/cms/asset/274bc8f0-17de-40fe-8831-9d08a1f75373/kbie_a_2274150_f0008_oc.jpg)
Data availability statement
The datasets for this study can be found in the [Web of Science] [https://www.webofscience.com/wos/alldb/basic-search].