
Figures & data
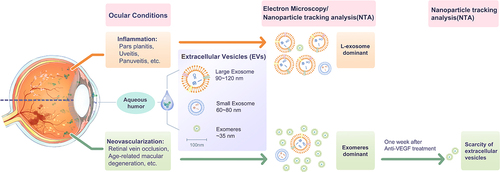
Figure 1. Aqueous humor exosomes in different ophthalmic diseases. Patient A: wet age-related macular degeneration (wet AMD); patient B: diabetic macular edema (DME); patient C: polypoidal choroidal vasculopathy (PCV); patient D: geographic atrophy; patient E: myopic choroidal neovascularization (myopic CNV). Patient F: proliferative diabetic retinopathy with tractional retinal detachment. Patient G: central retinal vein occlusion. Patient H: vitreous hemorrhage. Retinal color fundus photos (A1-H1), optical coherence tomography (A2-H2), and fluorescent angiography (A3-H3) were used to make the diagnosis×. Exosomes from aqueous humor were captured on anti-CD63 antibody-immuno-affinity modified filter paper, then images were obtained by scanning electron microscopy (A4-H4).
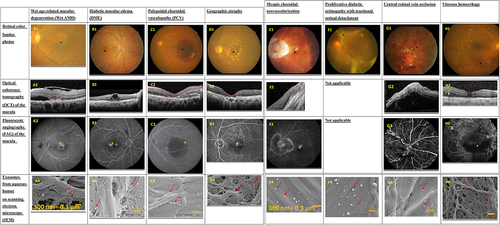
Figure 2. The distribution of particle size in aqueous fluid of patients with central retinal vein occlusion, ocular inflammatory and vitreous hemorrhage. The Y-axis represents exosome concentration (particles/ml) and the X-axis represents the size of each exosome (in nanometers). (a) Patient with central retinal vein occlusion without treatment. The major peak was at 68 nm width (red arrow). The total concentration was 2.62 × 10⁹ ± 9.97×10⁸ particles/ml. (b) One month after the patient with central retinal vein occlusion received an anti-vascular endothelial growth factor injection. After treatment, the total concentration decreased to 2.90 × 10⁸ ± 2.02×10⁸ particles/ml, and the major peak was at 48 nm width (red arrow). (c) Patient with ocular inflammatory disease(pars planitis) without treatment. The total concentration was 4.47 × 10⁹ ± 9.22×10⁸ particles/ml. The peak concentrations of nanoparticles were at 113 and 159 nm (red arrow). (d) Patient with vitreous hemorrhage. The total concentration was 1.18 × 10⁹ ± 5.02×10⁸ particles/ml. The peak concentrations of nanoparticles were at 50 and 88 nm (red arrow). Nanoparticle tracking analysis showing exosome size (X axis) and signal intensity (Y axis) in the aqueous humor from patients with different ocular conditions. Each sample was tested three times. The patient with central retinal vein occlusion (e,g) had a large number of exomeres, however the number obviously decreased after treatment. (g) The patient with ocular inflammation (pars planitis) had mainly large exosomes. (h) The exosomes in the patient with vitreous hemorrhage were mostly exomeres. The control group had two clusters of exosomes that were different compared with the disease group. In the control group, there were two major clusters with the same distribution pattern, which one cluster at 100 nm and the other at approximately 200 nm. Compared with the control group, the disease groups had a clearly different pattern.
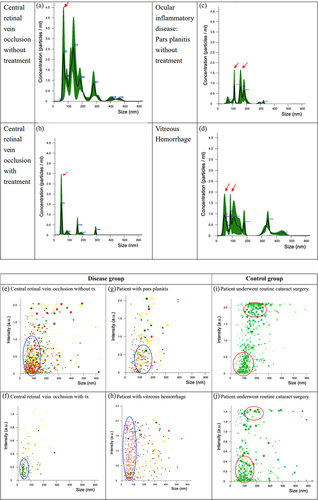
Table 1. Patient information. The concentrations of EVs decreased after anti-VEGF treatment in the patient with central retinal vein occlusion. In addition, the size distribution of EVs changed after anti-VEGF treatment.