
Figures & data
Figure 1. Expression of GPR65 chimeric constructs as soluble proteins. a) AlphaFold models representing human GPR65 (Uniprot entry Q8IYL9), truncated human apolipoprotein E (Uniprot entry P02649, PDB 1BZ4) and a representative example of the chimeric proteins, here displaying ECL2 of GPR65 (yellow) from the ApoE3 backbone (green). The transmembrane and ICL of GPR65 are in dark blue, with alternative GPR65 ECL in orange. Within the WT ApoE3 protein, the light blue region indicates the substituted residues, with red sites representing critical interactions between the two helices, which maintain structural integrity of the protein. b) SDS-PAGE gel of cell lysates before (b) and after (a) induction, and soluble (S) and insoluble (IS) fractions of expressed proteins for chimeric constructs with ECL2, representative for both ECL1 and ECL3. The + ‘x’aa represents how many amino acids on each side of the loop, as part of the helix, were also substituted with those from native GPR65. Correct bands are observed between 22 and 23kDa. Red squares represent a lack of soluble protein.
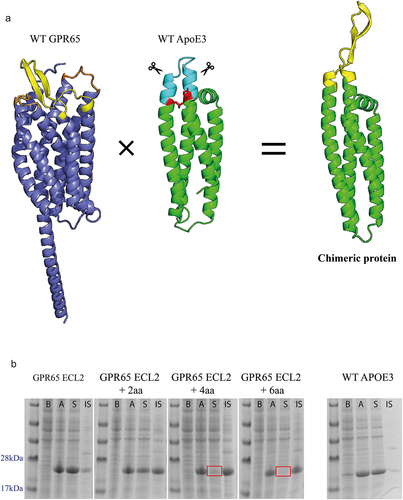
Figure 2. Generation of GPR65 antigen-specific monoclonal antibodies, using phage display. a) Schematic of phage display panning; three constructs representing each extracellular loop of GPR65 were pooled and acted as antigen throughout all stages of phage panning, for each of the three libraries screened (2 naïve scFv and naïve VHH). The antigen concentration remained the same throughout each round (1.5µM) and rounds 2 and 3 also included a subtraction step against WT ApoE3 (yellow boxes), to remove antibodies that bound the backbone. Eight pans were generated, each representing a different panning strategy. Phage antibody-containing supernatant was analyzed by ELISA against the pool of three chimeric constructs, WT ApoE3 and neutravidin. Those positive only on the construct plate were selected as antigen-specific hits, whilst those which also bound ApoE3 were deemed backbone binders. b) Binding results from each of the different panning conditions. c) Representative ELISA plates for pans 1 and 3 (half a plate each; pan 1 on the left-hand side, pan 3 on the right-hand side).
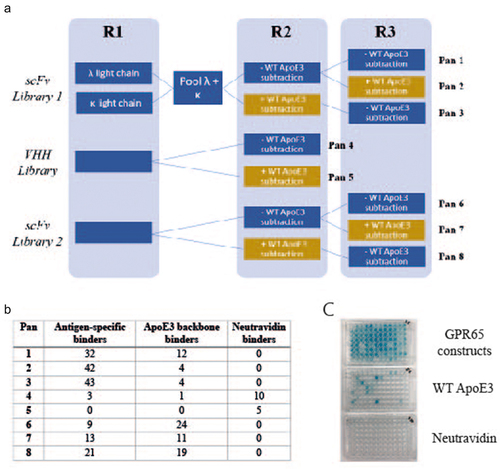
Figure 3. Phage derived antibodies specifically bound ECL1 and ECL2 GPR65 chimeric constructs. 20 cloned antibodies were expressed, and antibody-containing supernatant binding was tested by ELISA against plate-bound individual chimeric constructs or as a pool, to determine their specificity (numbers provided are optical density values). Layouts of antibodies tested were repeated across the plate, per each binding profile (ECL1, ECL2, ECL3 and a pool of all three in ‘All’). Binding is highlighted in green. The purple wells represent values from the secondary antibody control, the blue wells are blank controls, and the red values from mock transfected HEK cell supernatant, as an additional control.
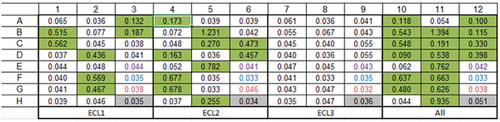
Figure 4. Phage-derived antibodies raised against chimeric constructs were able to recognise GPR65 expressed on HEK cells. a) GPR65 construct containing hemagglutinin (HA) signal sequence to encourage trafficking to the cell surface, FLAG tag to confirm surface expression, 3C and TEV protease sites to cleave off tags, His tag to aid with purification and GFP to aid with detection of gene expression. b) The construct was transiently transfected into HEK cells and incubated for 24 h. Binding was analyzed by flow cytometry, after initially gating on forward and side scatter, by FLAG expression, through a PE-conjugated anti-FLAG antibody, and detection of GFP. Wild type HEK cells are depicted in blue, whilst HEK cells transfected with human GPR65 are depicted in green. Percentage of GPR65 positive cells (green) is stated within the plots. Diluted phage-derived antibody-containing supernatant was incubated with HEK cells ±GPR65, and binding was detected using an anti-rabbit Fc. c) Initial HEK cell screen of all phage-derived antibodies, highlighting 3 titrating GPR65-specific binders. d) Flow cytometry plots of the three GPR65-specific binders where GFP+ cells represent GPR65 expressing cells (green), whilst GFP− cells (reg and grey) represent the internal negative control of cells not successfully transfected with GPR65 DNA, while mock cells (orange) reflect WT HEK cells having undergone the transfection protocol, without the addition of any DNA.
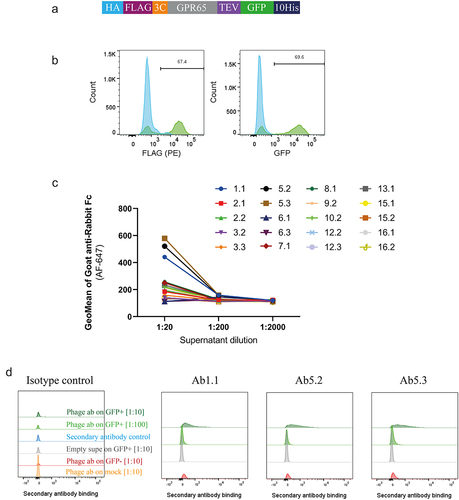
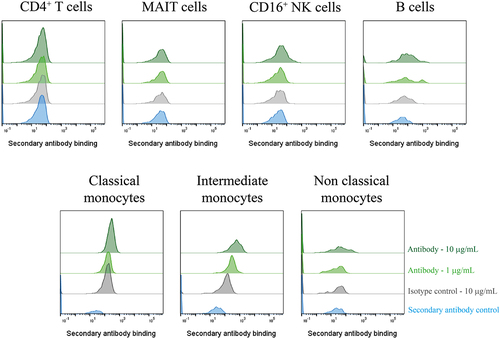
Figure 5. A GPR65-specific monoclonal antibody was successfully derived from phage display of a chimeric protein. PBMCs were isolated from a healthy control (n = 1), treated with Fc block for 10 min, then phage-derived antibody incubated with the cells for 1 h. DAPI-negative live cell subsets were identified according to their phenotypeFootnote1 before secondary antibody (anti-rabbit IgG AF647) binding was assessed by flow cytometry. Phage-derived antibody binding is depicted in light or dark green, at 1µg/mL or 10 µg/mL respectively, with the secondary antibody control depicted in blue, and the isotype control reflected in grey. Ab1.1 is the example shown.
Original Image Figure 1B Part 1.jpg
Download JPEG Image (1.6 MB)
Original Image Figure 1B Part 2.jpg
Download JPEG Image (1.6 MB)
Data availability statement
The data that support this study are available from the corresponding author, JB, upon reasonable request.