
Figures & data
Table 1. Examples of published works on SSF for enzyme production.
Figure 1. Process flowchart of the different biorefinery scenarios for the application of enzymatic hydrolysis in OFMSW treatment. (a) Scenario I, commercial enzymes and solid hydrolysate valorization through SSF. (b) Scenario II, commercial enzymes and solid hydrolysate valorization through anaerobic digestion. (c) Scenario III, in situ produced enzymes and solid hydrolysate valorization through SSF. (d) Scenario IV, in situ produced enzymes and solid hydrolyzate valorization through anaerobic digestion.
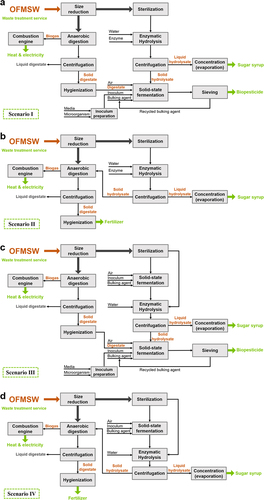
Table 2. Parameters for the economic evaluation.
Table 3. Overall component balance in a year for each scenario.
Figure 2. Total energy consumption and production per ton of processed OFMSW in the different biorefinery processes for each scenario.
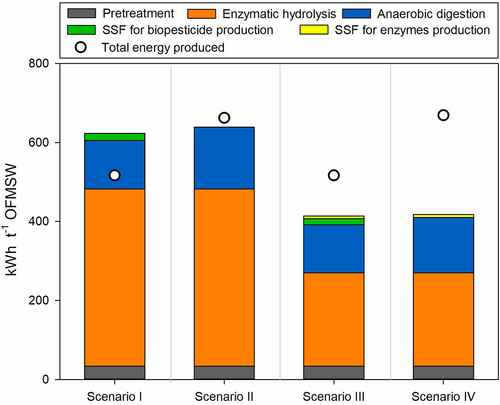
Table 4. Overall economic evaluation of the four OFMSW biorefinery scenarios.
Figure 3. Investment cost, operating cost, revenues and cumulative net present value (NPV) for the four OFMSW biorefinery scenarios. FOC, fixed operating cost. VOC, variable operating cost.
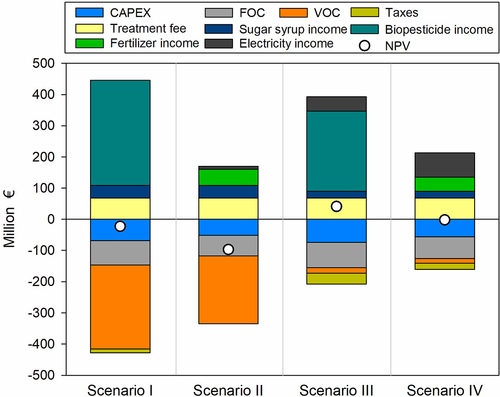
Figure 4. Static tornado diagram for each scenario showing the sensitivity of net present value (NPV) to the variation (±25%) in each variable while other variables are held constant. The nominal value is displayed as a vertical line.
Figure 5. (a) Cumulative cash flow diagram at different discount rates (0%, 6% and 12.8%) for scenario III. (b) Breakeven chart of scenario III.
Supplementary material.docx
Download MS Word (156.2 KB)Data availability statement
The data supporting the findings of this study are available within the article and its supplementary material.