
Figures & data
Figure 1. The tolerance of Tetratostichococcus sp. P1 under the presence of Cd. (a) Daily total Chl. (b) Pigment content. (c) Daily growth rate Chl (µ). Statistically significant differences between means were determined using one-way ANOVA post-hock Turkey’s test (*=p ≤0.05) following IBM SPSS statistical software (ver.25). Error bar is standard deviation (n = 3).
Figure 2. Morphological image of Tetratostichococcus sp. P1 under a microscope at 100× magnification. (a) morphology under control. (b) Morphology under 10 µM of Cd. (c) Morphology under 20 µM of Cd. (d) Morphology under 50 µM of Cd. e - f. morphology under 100 µM of Cd. Yellow arrow showing vacuole-like organel. Blue arrow showing non green part of the cell. The picture was taken after 6 days of cultivation.
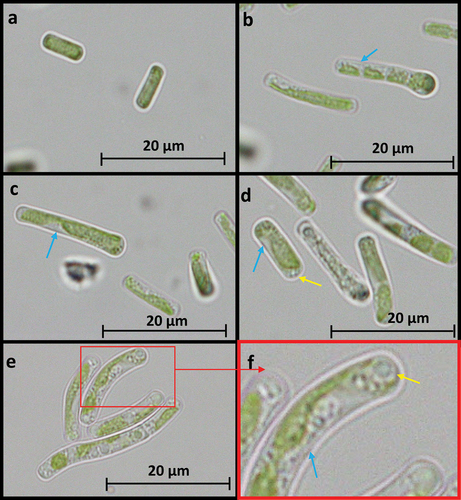
Figure 3. Cd removal by Tetratostichococcus sp. P1. (a) Removal after treatment. (b) Percentage removal. N = 3.
Figure 4. GO function classification.
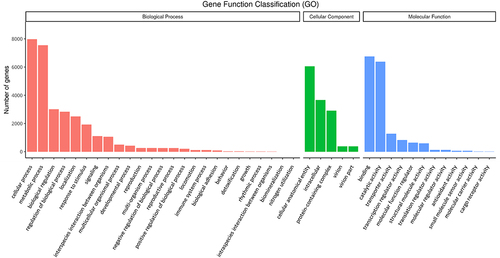
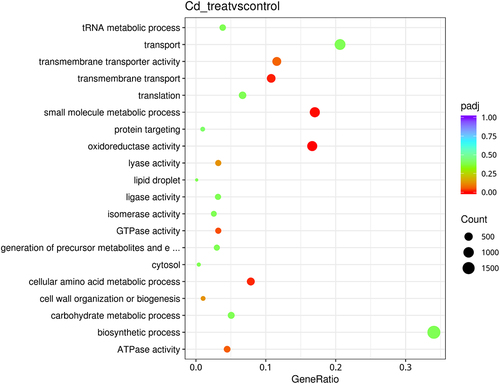
Figure 5. GO enrichment dot chart of DEGs.
Supplemental Material
Download MS Word (1.3 MB)Data availability statement
All data generated or analyzed during this study are included in this published article (and its Supplementary Information files). The species sequence data used in this paper have been superseded by the 18S GenBank record [MT053478] (https://www.ncbi.nlm.nih.gov/nuccore/MT053478.1). The raw data that used for transcriptomic analysis was deposited in to BioProject, NCBI [PRJNA1049646] (https://www.ncbi.nlm.nih.gov/bioproject/?term=PRJNA1049646).