
Figures & data
Table 1. Characteristics of healthy adult dogs from medium size used as fecal donors for in vitro experiments. M: male, F: female, BCS: body condition score (ranging from 1 – very thin to 5 – obese, 3 corresponding to ideal weight).
Figure 1. Experimental design in the CANIM-ARCOL. (a) The CANIM-ARCOL was inoculated with fecal samples from two medium dogs (one female and one male, i.e. two biological replicates). Three bioreactors corresponding to three sizes conditions (i.e. small under 10 kg, medium from 10 to 30 kg and large over 30 kg) were run in parallel for 9 days. (b) Samples were regularly collected in the atmospheric phase, in the luminal medium and from mucin beads to monitor microbiota composition and fermentation metabolites.
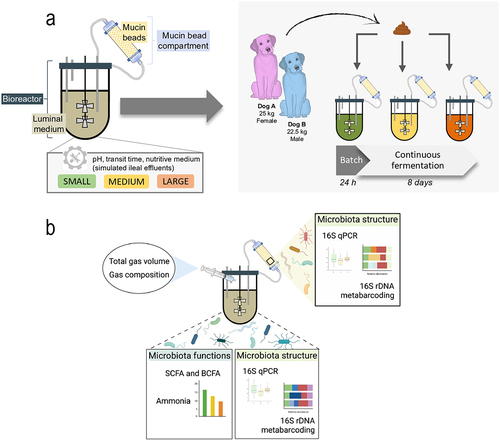
Table 2. Nutritional and physicochemical parameters used to set up the CANIM-ARCOL under three dog size conditions. rpm: rotation per minute.
Table 3. Primers used for qPCR and 16S metabarcoding analysis.
Figure 2. Stool characterization for each canine donor. Stool samples were collected from two healthy medium dogs. Microbiota composition was analyzed by 16S metabarcoding. Bacterial abundances are represented at the phylum (a) family (b) levels. The three main SCFA (i.e. acetate, propionate and butyrate) were measured and expressed as total concentration (c and d) and relative percentages (e). Ammonia concentrations are given in (f).
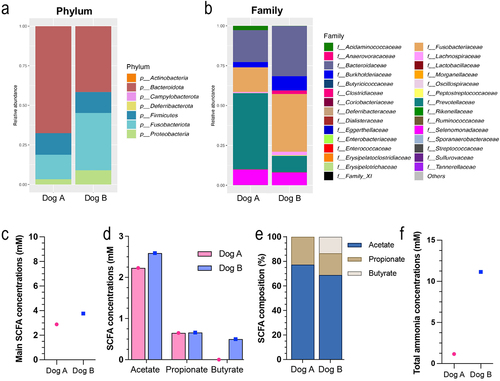
Figure 3. Impact of dog size on bacterial load and microbial diversity in the CANIM-ARCOL. Fermentations were performed in the CANIM-ARCOL under three dog size conditions (i.e. small, medium, large), after inoculation with stools from medium size dogs (n = 2). Total bacteria were quantified and expressed as Log10 16S copies/g (a). Lumen and mucus-associated microbiota composition was analyzed by 16S metabarcoding and diversity indexes were calculated based on ASV table. α-diversity indexes (observed ASVs and Shannon) calculated from days 4 to 9 are represented as box plots in the luminal medium (b) and mucin beads (c). Beta-diversity of samples from days 4 to 9 was analyzed by PCoA showing clear donor (d) effect. Redundancy analysis (RDA) without donor effect based on Bray–Curtis distances indicated strong size effect (e). Significant differences based on Kruskal and Wallis test are presented as * p < 0.05, *** p < 0.001, **** p < 0.0001. ns = non-significant difference (p > 0.05).
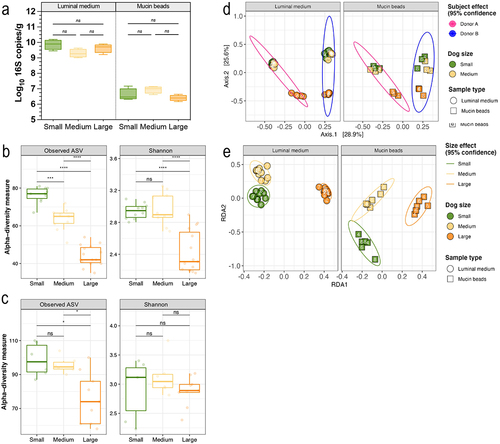
Figure 4. Impact of dog size on microbial composition in the CANIM-ARCOL. Fermentations were performed in the CANIM-ARCOL under three dog size conditions (i.e. small, medium, large), after inoculation with stools from medium size dogs (n = 2). Lumen and mucus-associated microbiota composition was analyzed by qPCR and 16S metabarcoding. Relative abundance of the main bacterial populations in both colonic microenvironments are represented at the phylum (a), family (b), and genus (c) levels.
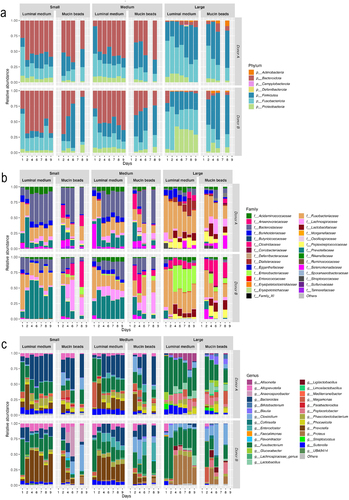
Figure 5. Differential analysis on dog size impact on microbiota composition at the genus level. Fermentations were performed in the CANIM-ARCOL under three dog size conditions (i.e. small, medium, large), after inoculation with stools from medium size dogs (n = 2). Lumen and mucus-associated microbiota composition was analyzed by 16S metabarcoding and differential analysis were further performed on days 2 to 9. Differential analyses based on DESeq2 method were performed to generate loading plots of the 10 most contributing genera between sizes in luminal medium (a) and mucin beads (b). Bars are colored according to the group in which the median abundance is maximal, small in green, medium in yellow and large condition in orange.
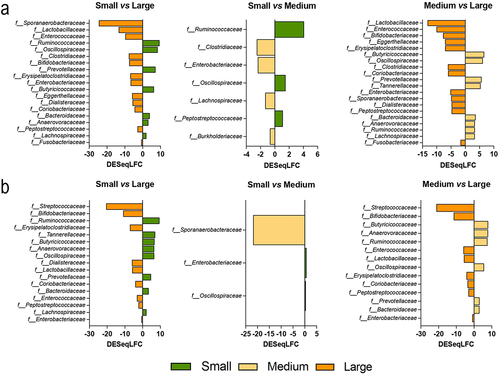
Figure 6. Impact of dog size on gas production in the CANIM-ARCOL. Fermentations were performed in the CANIM-ARCOL under three dog size conditions (i.e. small, medium, large), after inoculation with stools from medium size dogs (n = 2). Samples were regularly collected from atmospheric phase of bioreactors to determine gas composition. Results are expressed in relative percentages for dog a (a) and dog B (b). Daily total gas production is given in mL (c). Average gas composition from day 4 to day 9 was calculated per size condition and represented in (d). Statistical differences are indicated by different letters (p < 0.05) or ****: p < 0.0001 (ANOVA one-way).
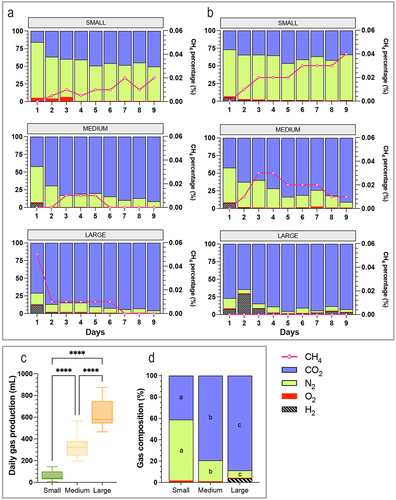
Figure 7. Impact of dog size on short-chain fatty acids and ammonia production. Fermentations were performed in the CANIM-ARCOL under three dog size conditions (i.e. small, medium, large), after inoculation with stools from medium size dogs (n = 2). Samples were regularly collected from luminal medium of the bioreactors to determine short-chain fatty acids (SCFA) and ammonia concentrations. The three main SCFA (i.e. acetate, propionate and butyrate) were measured daily throughout fermentations and results expressed in mean relative percentages (a, top) and concentrations (a, bottom). Average SCFA concentrations (b), SCFA composition (c) and ammonia concentrations (d) were calculated per size condition from day 2 to day 9. Statistical differences are indicated by *: p < 0.05, **: p < 0.01; ****: p < 0.0001 (ANOVA one-way).
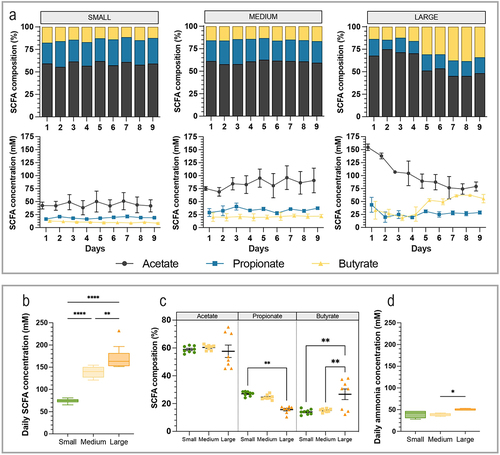
Figure 8. Correlations between explainable variables and microbial family abundances. Fermentations were performed in the CANIM-ARCOL under three dog size conditions (i.e. small, medium, large), after inoculation with stools from medium size dogs (n = 2). Lumen and mucus-associated microbiota composition was analyzed by 16S metabarcoding. Explainable variables included day of fermentation, sample type (i.e. luminal medium or mucin beads), physicochemical (i.e. pH, transit time, bile acid profiles) or nutritional (i.e. lipid, protein, carbohydrate and fiber content) parameters of bioreactors, as well as gut microbial metabolites (i.e. gas and SCFA) and bacterial family relative abundances. Luminal medium and mucin beads were combined, and Pearson correlations were calculated on days 2 to 9. Statistical differences are indicated by *: p < 0.05, **: p < 0.01; ***: p < 0.001.
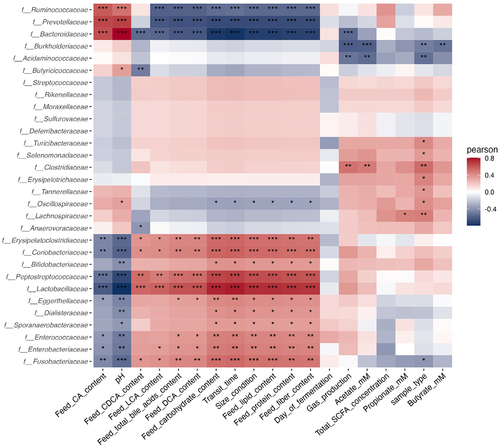
Table 4. In vitro–in vitro correlations related to dog size effect on colonic microbial populations and metabolic activities between previous results in the CANIM-ARCOL and those obtained in the present study. Previous results were extracted from Deschamps et al. [Citation26] and found when the model was inoculated with fecal samples from three dog sizes. Size effect was indicated by symbols: ![]() no size effect,
no size effect, ![]() decrease with size or
decrease with size or ![]() increase with size. Color code indicates similar tendency between the two studies (in green), clear opposite trends (in red) or no clear conclusion (in yellow). *: significant variations between sizes (p < 0.05). ND: not detected.
increase with size. Color code indicates similar tendency between the two studies (in green), clear opposite trends (in red) or no clear conclusion (in yellow). *: significant variations between sizes (p < 0.05). ND: not detected.
Table 5. In vivo–in vitro correlations related to dog size effect on gut microbial populations (a) and metabolic activities (b) between our in vitro results in the CANIM-ARCOL and data from fecal samples in vivo. Data from dog fecal samples are extracted from Deschamps et al. (2022). Presence of bacterial populations was indicated by ‘yes’ if present or ‘no’ if absent (not found in the main bacterial populations). Size effect was indicated by symbols: ![]() no size effect,
no size effect, ![]() decrease with size or
decrease with size or ![]() increase with size. Color code indicates similar tendency between in vitro and in vivo data (in green), clear opposite trends (in red) or no clear conclusion due to lack of data or inconsistencies (in yellow). ND: not determined. [Citation60–67]
increase with size. Color code indicates similar tendency between in vitro and in vivo data (in green), clear opposite trends (in red) or no clear conclusion due to lack of data or inconsistencies (in yellow). ND: not determined. [Citation60–67]
Data availability statement
Raw metabarcoding data that support the findings of this study are openly available at https://www.ncbi.nlm.nih.gov, BioProject number PRJNA955438.