Figures & data
Figure 1. Engineering stress–strain curves of Mg alloy samples under T4 treatment and hot rolling with different thickness reductions (marked by the curves).
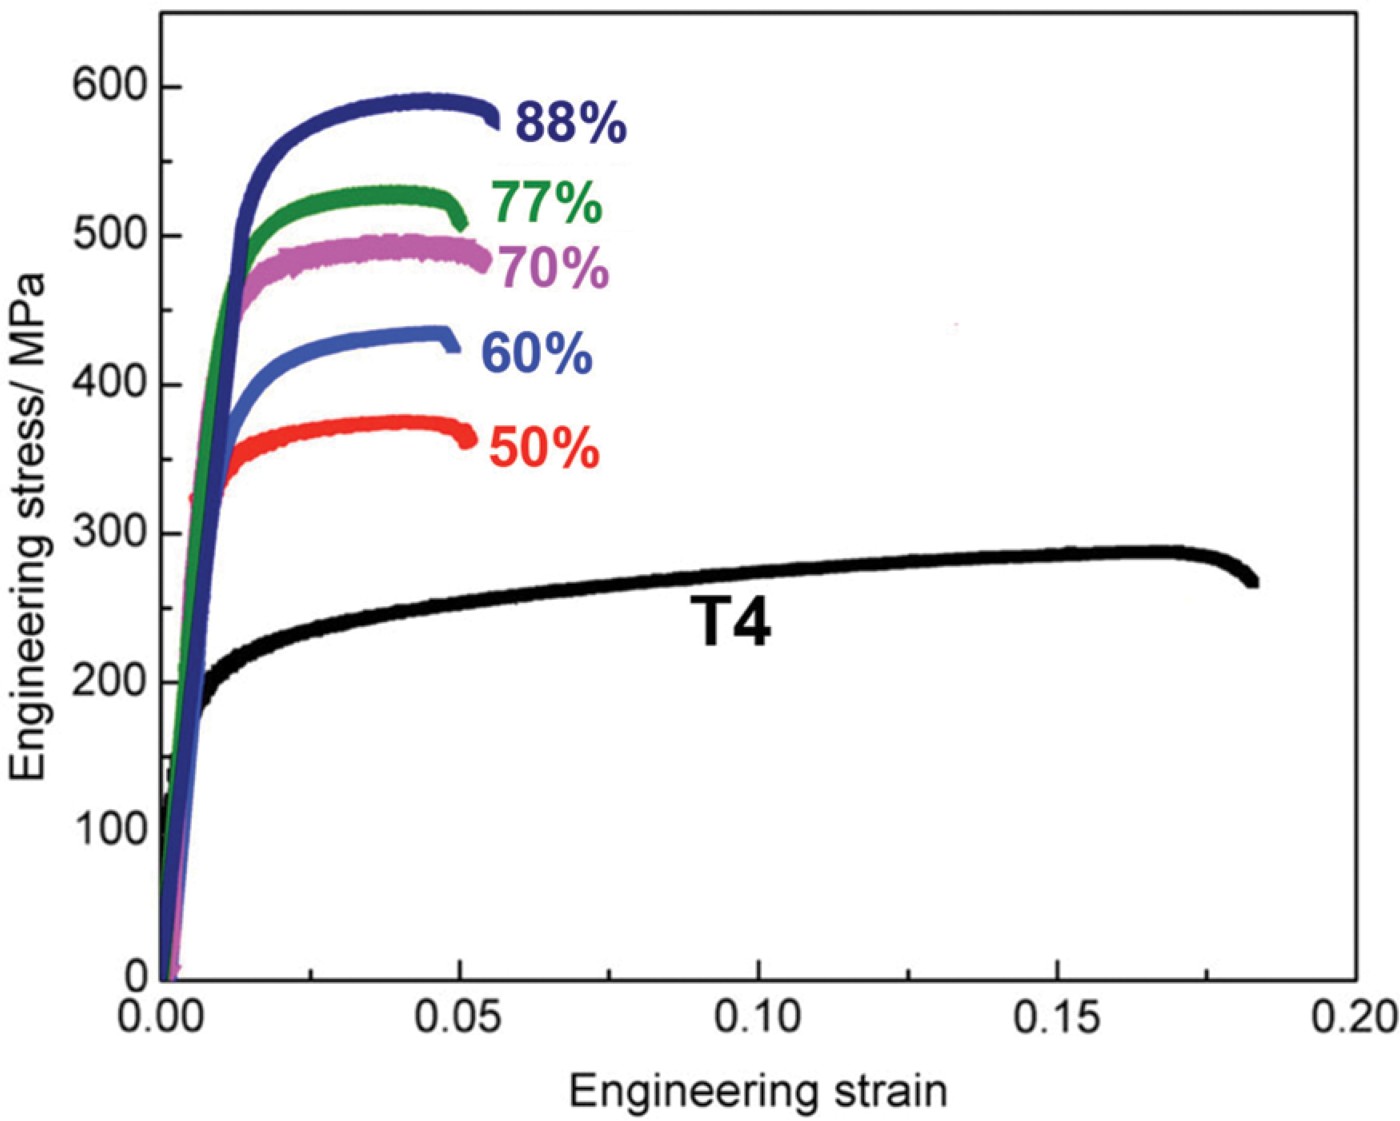
Figure 2. Summary of room temperature tensile yield strength and uniform elongation of previous reports and our current work. The criteria used to summarize and reproduce this figure are Equation(1) only room temperature uniaxial tensile test results were included, (2) the gauge length of tensile test sample was larger than 5 mm and (3) the stress–strain curve must be indicated in the individual report in order to reproduce the uniform elongation. The reference number is adjacent to the data point.
Note: Ref. Citation8 reported a Mg alloy with a yield strength of 600 MPa, but its uniform elongation is not available.
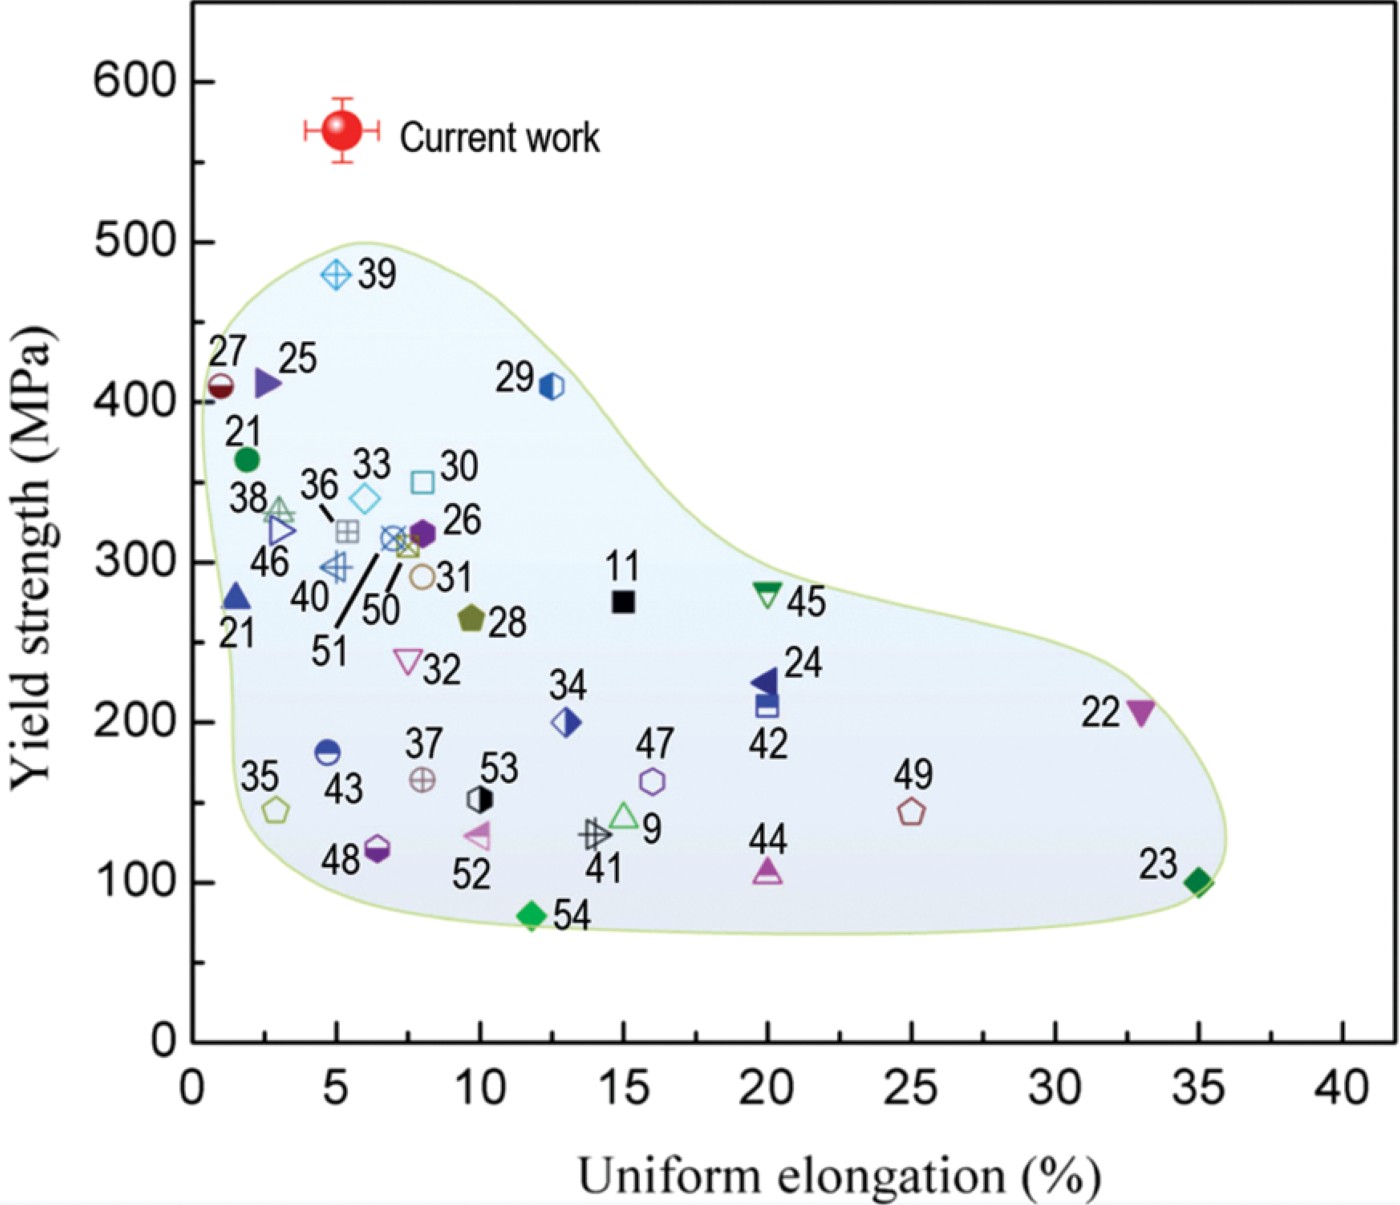
Figure 3. TEM images of Mg alloy samples with various rolling thickness reductions: (a) 50%, d=55 nm, (b) 70%, d=25 nm and (c) 88%, d=16 nm. Image (d) is the SAD pattern of the 70% rolled sample in which the streaking verifies the basal plane SFs.
Figure 4. Yield strength vs the reciprocal of mean spacing between SFs of rolled samples with different thickness reduction. The number by each data point indicates the thickness reduction by hot rolling.
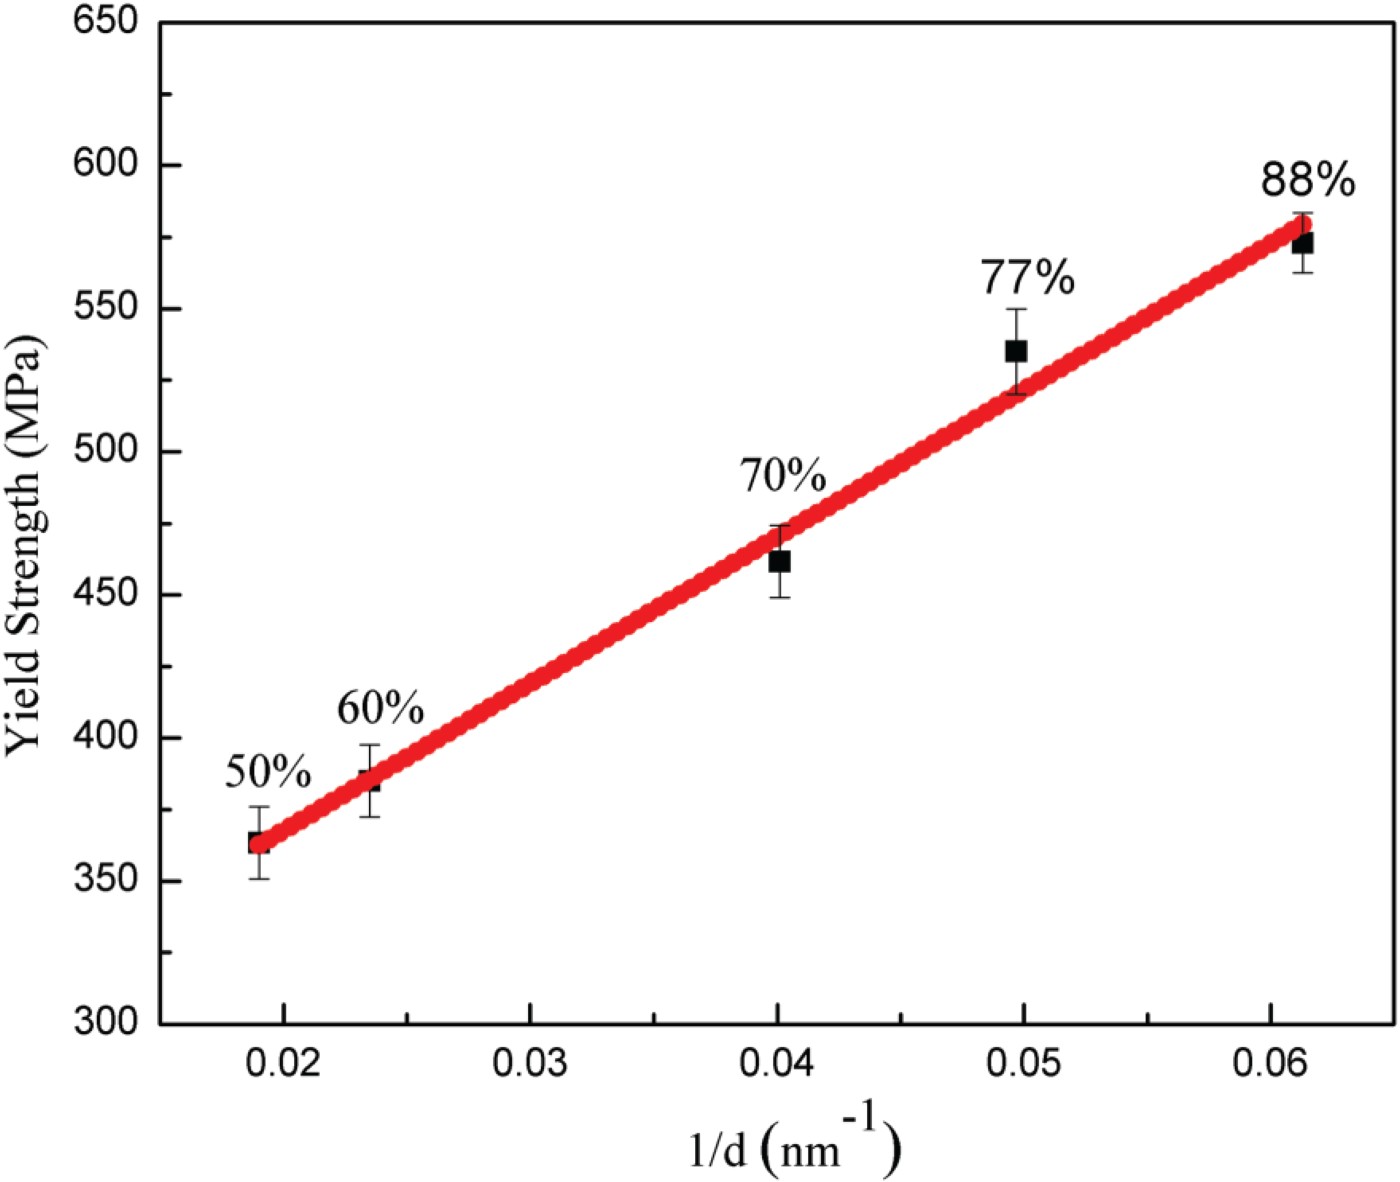
Figure 5. TEM images of 88% hot rolled sample after tensile test. (a) Fragments of SFs cut by the dislocations marked by white arrows (b) High density of dislocations was trapped between SFs.