Figures & data
Figure 1. (a) Despite high rates and fine nanoscale thick layers, the interface on the left ((b) KS {111}| | {110}) does not form twins. Only the Cu–Nb interface structure in the center (labeled {112}| | {112}) forms twins in the upper Cu crystal Citation34. (c) Higher magnification of a typical twin in (a). High-resolution TEM micrograph of a typical (b) KS {111}<110>Cu| | {110}<111>Nb interface showing that it is atomically flat and (d) {112}<111>Cu| | {112}<110>Nb interface showing that it is faceted.
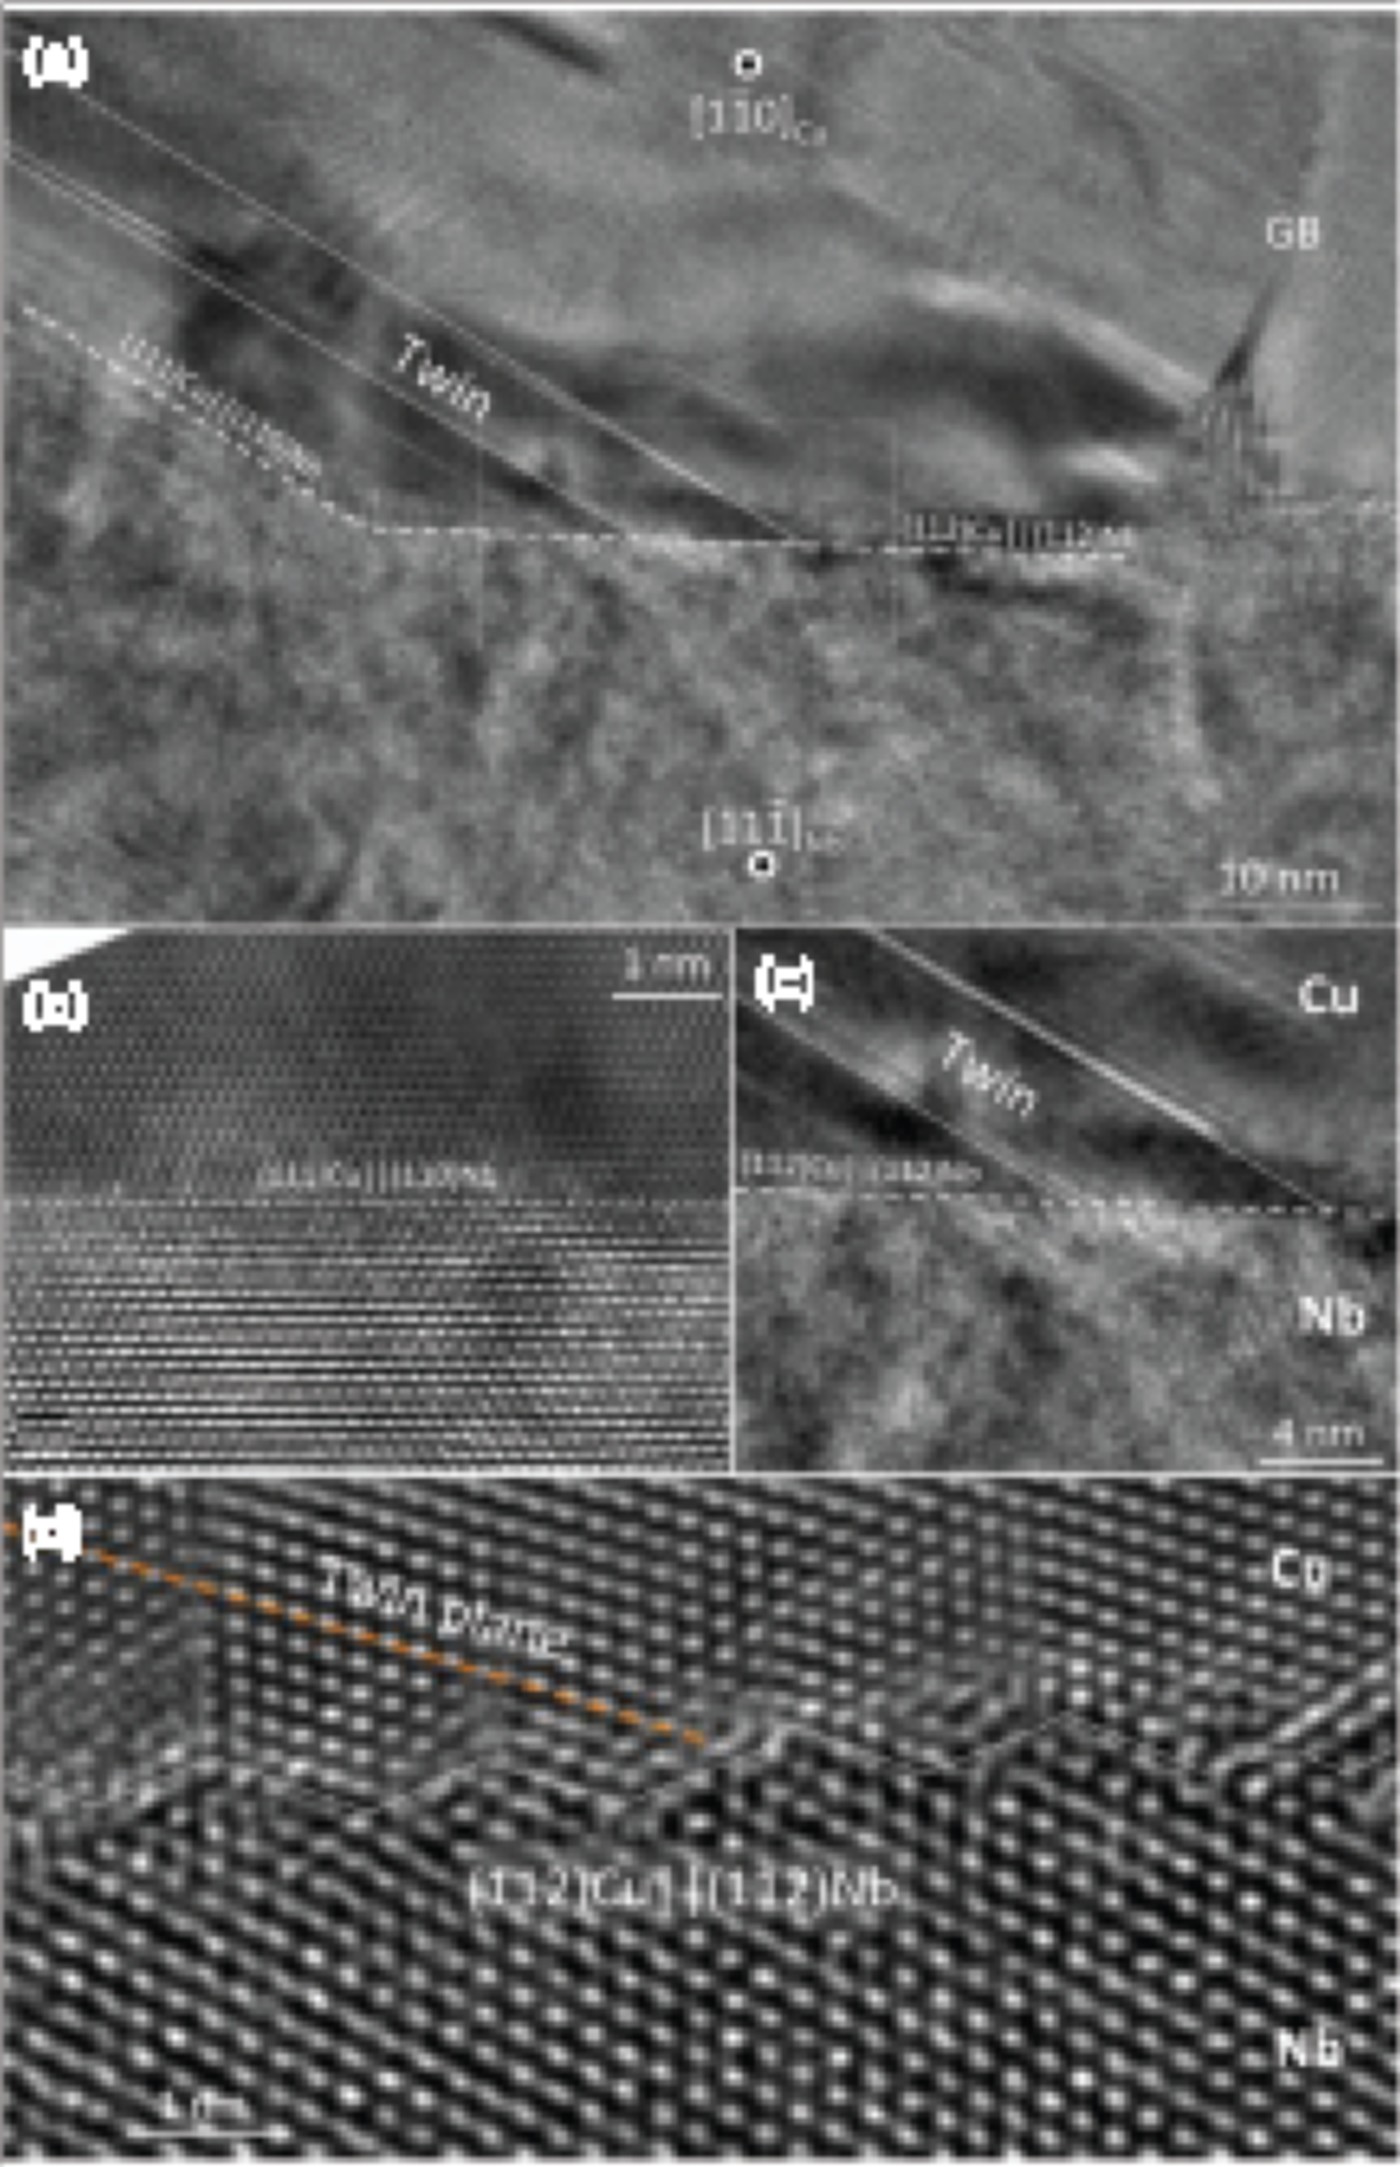
Figure 2. Illustration of twin nucleation directly from an interface due to its intrinsic structure. (a) A distribution of interface dislocations. Two sets are shown, each with a different total Burgers vector B
(1) and B
(2). Both sets have a Burgers vector component that is non-planar to the interface ( and
, respectively, although these components are not explicitly marked). (b) Dissociation of two interface dislocations, each into a residual and a TD that extends into the upper crystal. The TD forms a stacking fault as it glides. The two neighboring stacking faults, SF1 on the left and SF2 on the right, are spaced a distance s apart that equals the spacing of the two dissociation sites. The number of twin planes encompassed by s is equal to k. (c) Nucleation of k=2 TDs in between SF1 and SF2. As the k TDs glide away from the interface, they form a twin domain between SF1 and SF2. For a discussion on calculating k, please see supplement and Figure S2.
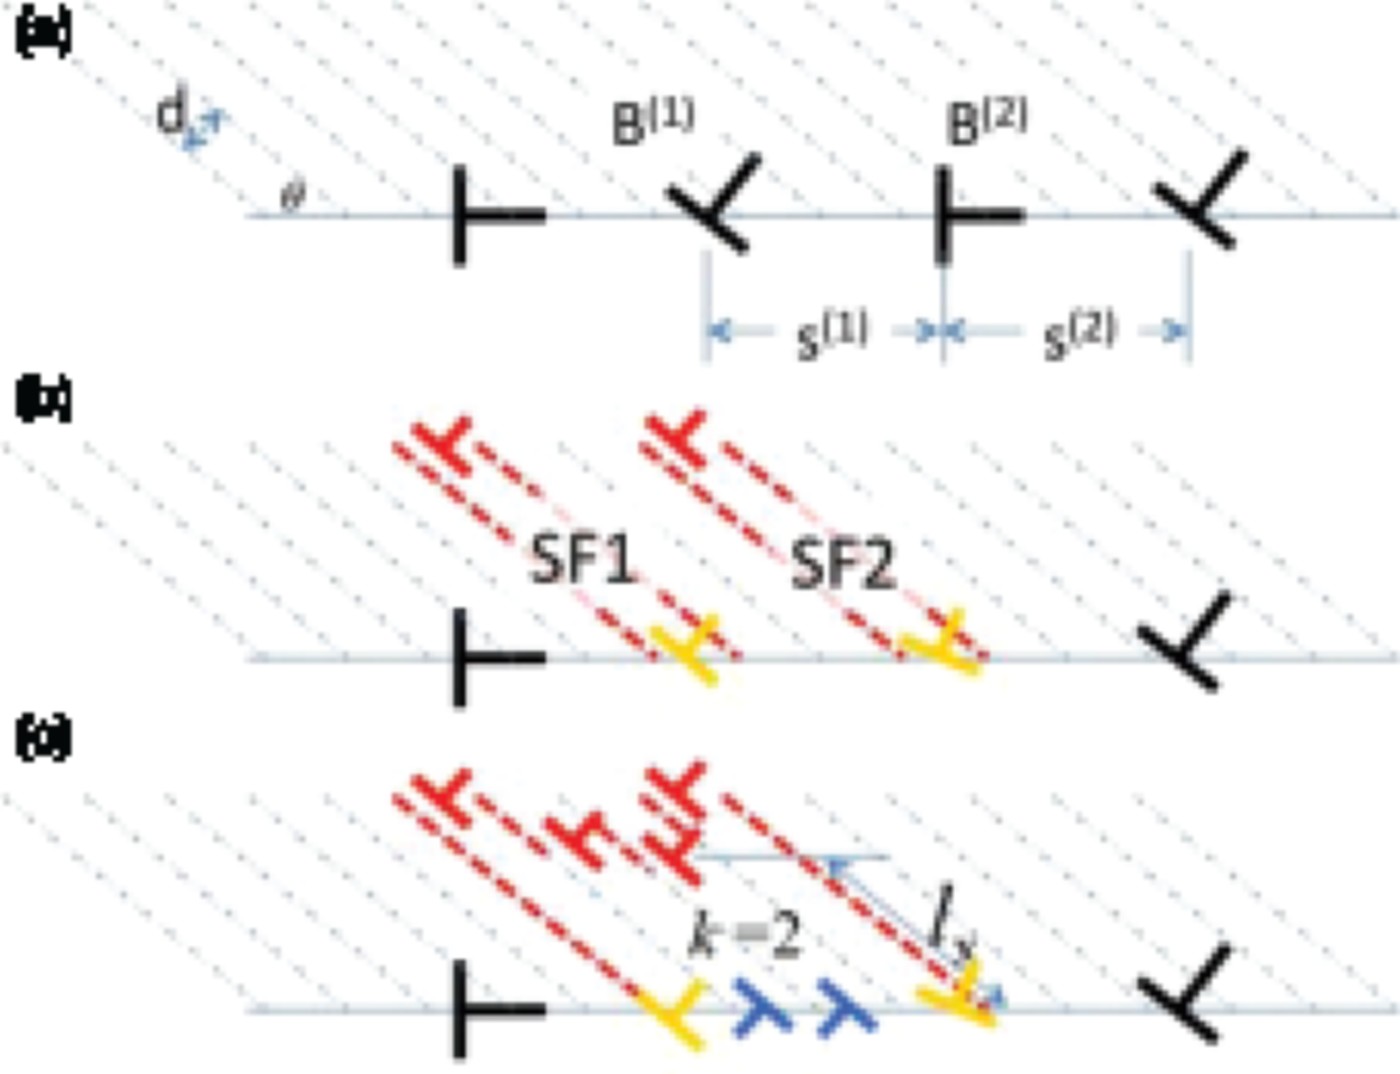
Figure 3. Transmissibility map for bimetal interfaces. Interfaces lying in the region near the origin are not as likely to permit slip–twin transmission and those lying away are more likely. Other areas marked ‘difficult’ correspond to regimes where slip–twin transmission would be difficult, but not impossible, requiring high stresses or high temperatures. Some experimental points are shown as ellipses. In these cases, interfaces from which twins form are colored in black and those from which they do not are colored in blue. Other experimental points are shown as rectangles due to the anisotropy in their interfacial shear strength (ISS). The ISS can be highly anisotropic, depending strongly on the direction of in-plane shearing Citation27 Citation30. In such cases, like the KS or NW interface, it is appropriate to report a range of τISS values, while for mildly anisotropic ones, reporting a single value suffices.
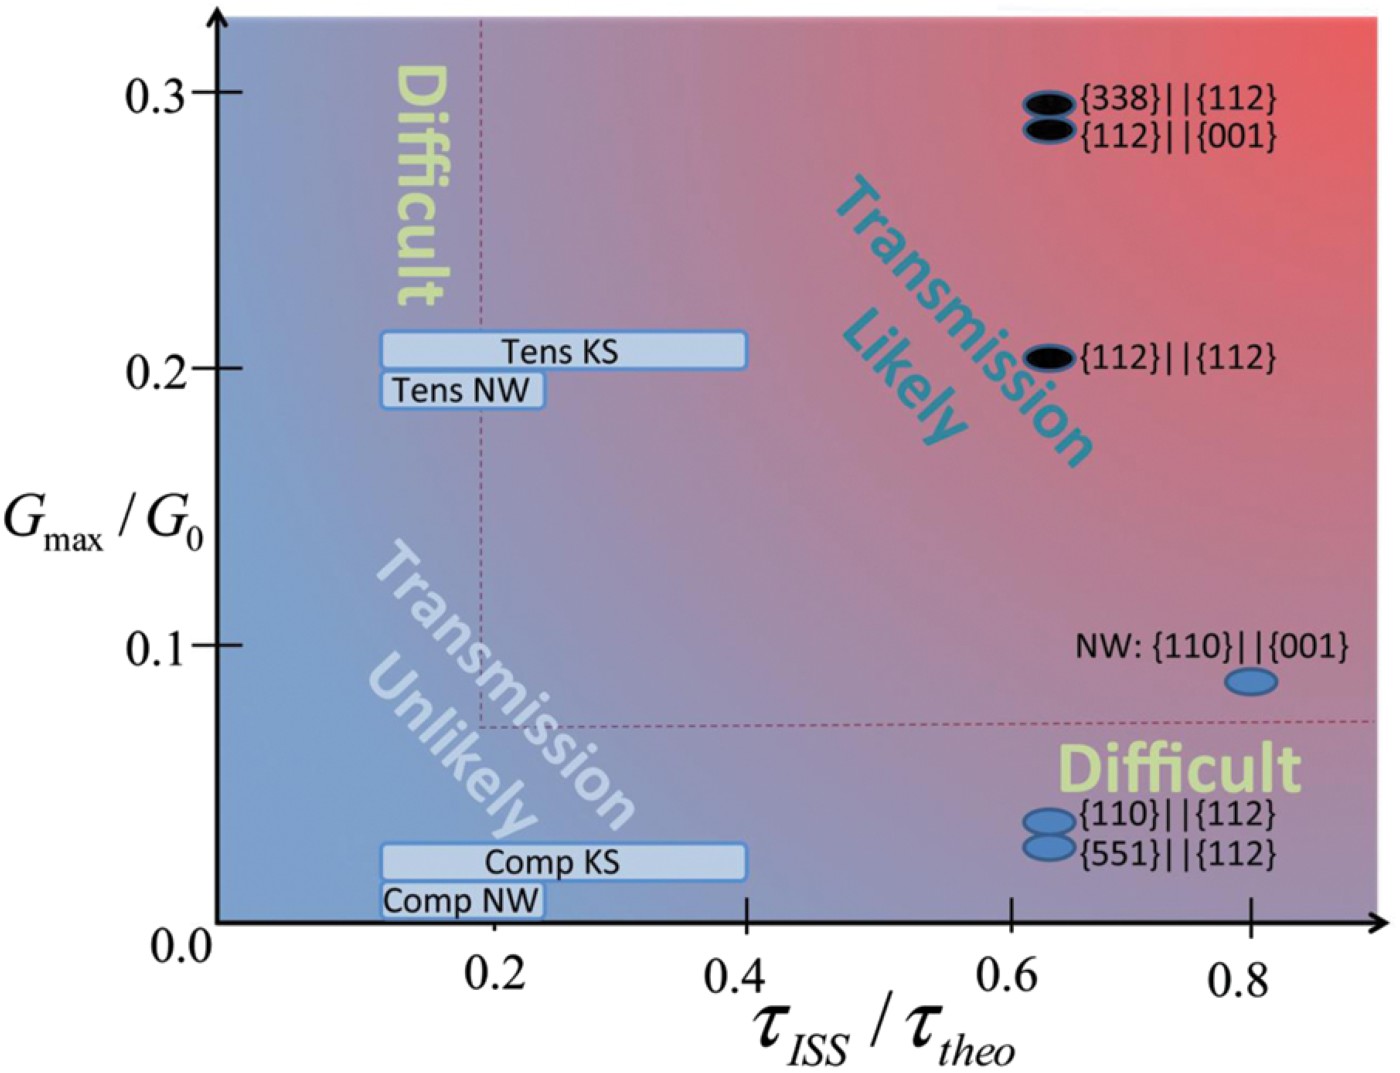
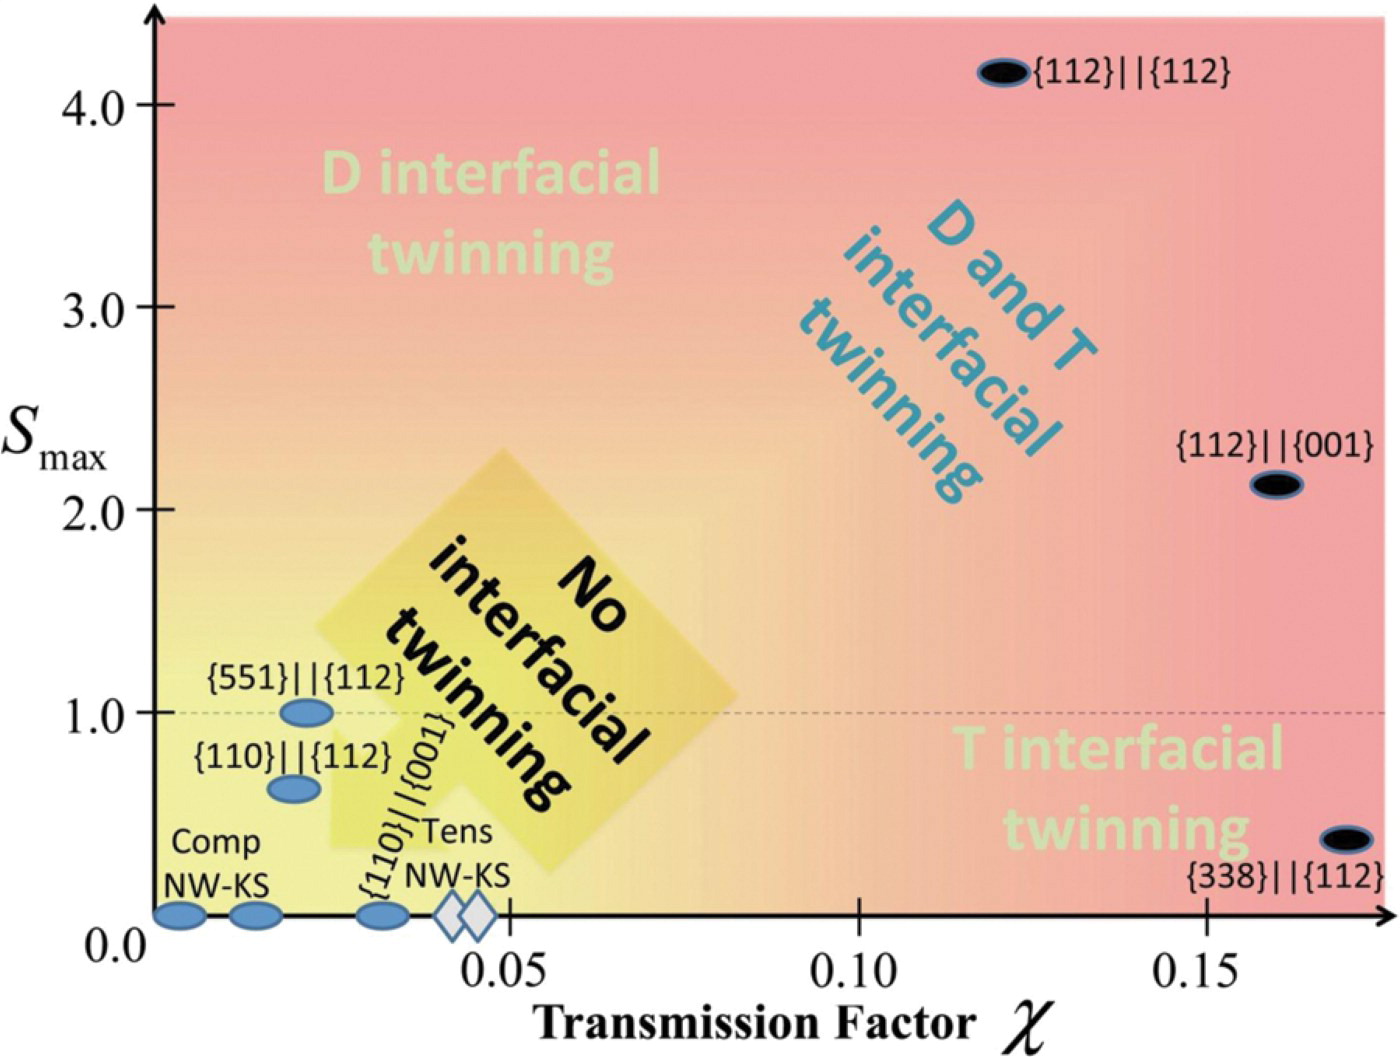
Figure 4. Twinnability map for bimetal interfaces. Interfaces lying in the region near the origin are not likely to twin and those lying away are more likely to twin by the T or D or both mechanisms. Regions where twinning occurs predominantly by the D or the T mechanism are also indicated. The figure-of-merit for the T-mechanism (x-axis) accounts for the number of effective transmission pathways, χ=(τISS/τtheo)(G max/G 0)/N (see Figure S3). Experimental points are shown as ellipses. Interfaces from which twins are observed to form easily and often are colored in black and those from which they did not are colored in blue. All cases are for compression or plane strain compression applied normal to the interface plane. The diamond symbols indicate predictions. NW and KS interfaces are predicted not to form twins when a tensile load is applied normal to the interface.