Figures & data
Fig. 1. 475 keV Nb PKA passing through a ∼1/2 billion-atom model of a-Cu50Nb50. (a) Trajectory of PKA plotted in red,>1 keV KAs in black, and atoms displaced by 0.5–1 nm in blue. (b) Temperature fields due to inter-nuclear collisions. Red voxels have Tmax>TG=1, 500 K,[Citation16] blue contour is for Tmax=350 K. (c) TS-induced plastic deformation. Black voxels have εp>0.0125 at t=12 ps. The boxed TS is analyzed in detail in and .
![Fig. 1. 475 keV Nb PKA passing through a ∼1/2 billion-atom model of a-Cu50Nb50. (a) Trajectory of PKA plotted in red,>1 keV KAs in black, and atoms displaced by 0.5–1 nm in blue. (b) Temperature fields due to inter-nuclear collisions. Red voxels have Tmax>TG=1, 500 K,[Citation16] blue contour is for Tmax=350 K. (c) TS-induced plastic deformation. Black voxels have εp>0.0125 at t=12 ps. The boxed TS is analyzed in detail in Figures 2 and 3.](/cms/asset/b49bf4b0-9e30-4fc6-96db-52f62729aefe/tmrl_a_916760_f0001_c.jpg)
Fig. 2. Stresses and strains inside and adjacent to the TS boxed in (c). (a) Pressure versus time in the TS and in adjacent material. Von Mises stress (b) and tensile work-equivalent plastic strain (c) versus time, averaged over all voxels within 4 nm of the TS.
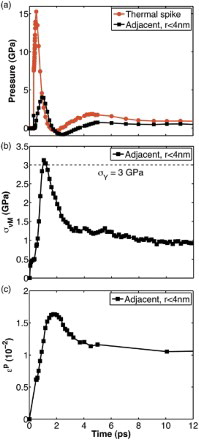
Fig. 3. (a) Close-up view of the TS boxed in (c) with a cylindrical coordinate system defined along the TS major (z) axis and voxels with εp>0.0125 in black. (b) An initially ellipsoidal TS (dashed line) deforms into a more spherical shape (solid line) when internally pressurized, yielding the illustrated plastic strains in surrounding material. (c) Diagonal components of plastic strain computed at t=12 ps in cylindrical coordinates as a function of position along the major axis of the TS in (a). Shaded bands indicate uncertainties.
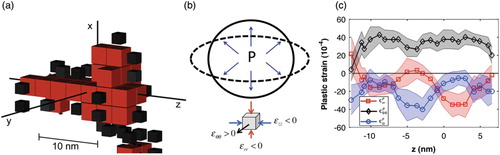
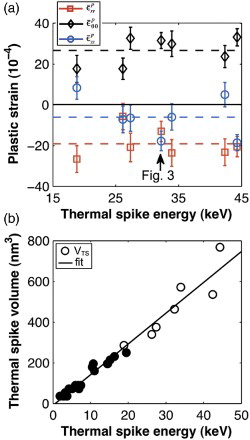
Fig. 4. (a) Voxel average plastic strain components in material adjacent to the seven largest TSs as a function of the TS energy. The arrow indicates the TS analyzed in and . (b) TS volume VTS versus deposited knock-on energy ETS. Linear fit: VTS=(15.1±0.6 nm3/keV)ETS−(8.9±11.2 nm3). Open symbols for TSs analyzed in (a).