Figures & data
Figure 1. Variation of both grain sizes and Vickers microhardness (Hv) along the depth in samples processed by SMAT for 5 min.
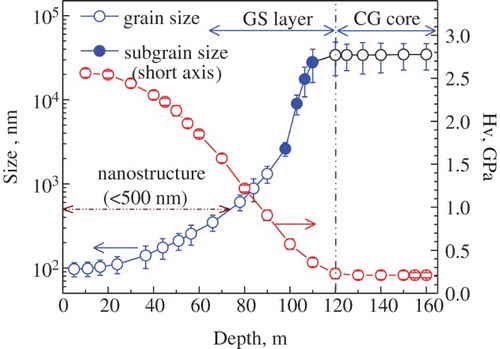
Figure 2. (a) Engineering stress-strain curves of integrated samples, the GS layers, and the CG sample. The volume fractions of the GS layers in the integrated samples are indicated on the curves. (b) The flow stress of the integrated sample (red curve) is much higher than that calculated using ROM (green curve) due to synergetic strengthening. (c) The measured yield strength of the integrated samples (red curve), the calculated yield strength using the ROM (blue curve), and the calculated yield strength using the modified ROM (green curve). Inset is the synergetic strengthening, Δσ, as a function of the volume fractions of GS layers.
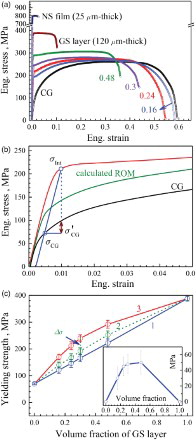
Figure 3. (a) Tensile engineering stress-strain curves with surface layers removed from both sides of the integrated sample with initial 120-μ m-thick GS layers. The legend indicates the thickness reduction from both sides. (b) Synergetic strengthening calculated using Equation (4) as a function of surface layer thickness removed. (c) Variation of Vickers microhardness along the depth after tensile testing to a strain of 1%.
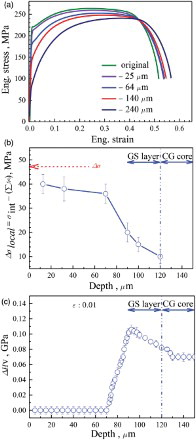
Figure 4. Schematic FEM model showing a quarter of the gauge section of tensile sample. The tensile load is applied along the z direction. The origin of the coordinates is located at the sample geometric center. x=0 represents the sample center (path 1) while x=1.25 mm represents the sample edge.
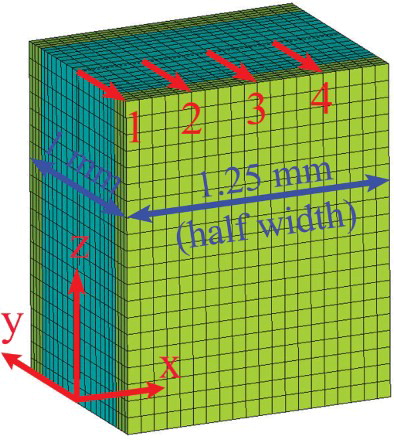
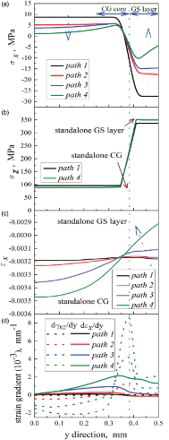
Figure 5. FEM simulation results. (a) Stress along the x-axis. (b) Stress along the z-axis. (c) Strain along the x-axis. (d) Both normal and shear strain gradients along the x-axis.