
Figures & data
Figure 1. (a) SEM micrograph using a backscattered-electron detector and (b) HAADF-STEM overview of an FIB sample of equiatomic Ho–Dy–Y–Gd–Tb. The material is perfectly homogeneous; no features due to composition variation, precipation, dendrite formation, etc. can be seen. In both micrographs, sample edges (dark) are visible.
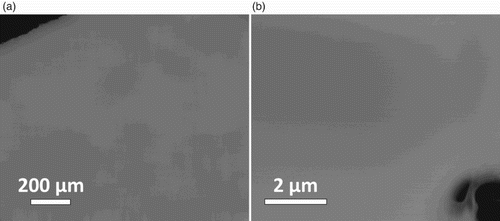
Figure 2. Electron diffraction patterns along different zone axes of the hexagonal structure: (a) [0 0 0 1] zone axis. (b) [1 1 1] zone axis: overlay of a short-time exposure displaying zero-order Laue zone reflections and a long-time exposure (inverted to enhance the weak spots) including first-order Laue zone reflections. (c) [1 1
0] zone axis. (d) [4 1
0] zone axis. (e) [1 0
0] zone axis.
![Figure 2. Electron diffraction patterns along different zone axes of the hexagonal structure: (a) [0 0 0 1] zone axis. (b) [1 1 1] zone axis: overlay of a short-time exposure displaying zero-order Laue zone reflections and a long-time exposure (inverted to enhance the weak spots) including first-order Laue zone reflections. (c) [1 1 0] zone axis. (d) [4 1 0] zone axis. (e) [1 0 0] zone axis.](/cms/asset/bcb7d99a-474e-4a0a-9b42-ea16f26c3d8a/tmrl_a_951493_f0002_b.gif)
Figure 3. Arrangement of zone axes and corresponding electron diffraction patterns, indexed according to a hexagonal Mg-type structure. The lines correspond to Kikuchi lines as seen in the TEM. Only half of the patterns surrounding [0 0 0 1] are shown. The indicated angle between [ 2
3] and [
2
6] is not to scale as indicated by the broken lines.
![Figure 3. Arrangement of zone axes and corresponding electron diffraction patterns, indexed according to a hexagonal Mg-type structure. The lines correspond to Kikuchi lines as seen in the TEM. Only half of the patterns surrounding [0 0 0 1] are shown. The indicated angle between [ 2 3] and [ 2 6] is not to scale as indicated by the broken lines.](/cms/asset/487fa251-397b-40f5-8d32-0254aa82c690/tmrl_a_951493_f0003_b.gif)
Table 1. Comparison between experiment and calculations on the basis of a hexagonal Mg-type structure with lattice parameters a=361 pm and c=569 pm.
Figure 4. HAADF-STEM micrographs of equiatomic Ho–Dy–Y–Gd–Tb with insets displaying the corresponding FFTs. (a) Along the [0 0 0 1] direction. (b) Along the [1 1 0] direction.
![Figure 4. HAADF-STEM micrographs of equiatomic Ho–Dy–Y–Gd–Tb with insets displaying the corresponding FFTs. (a) Along the [0 0 0 1] direction. (b) Along the [1 1 0] direction.](/cms/asset/ff61c3c1-ca6a-432f-8e40-eef826b97d9d/tmrl_a_951493_f0004_b.gif)