Figures & data
Figure 1. Schematic of the strategy to control phase growth by nanoparticles during solidification. (a) After the initial nucleation of the primary phase from liquid, the initially nucleated grains/phase domains grow rapidly and release latent heat, preventing the nucleation of new grains/phase domains. This results in a course structure. (b) In contrast, with uniform dispersed nanoparticles in the liquid, after initial nucleation, the nanoparticles rapidly adsorb on the surface of the nucleated phase and restrict their growth, enabling continuous nucleation in the whole period of cooling. Finally, a much fine microstructure can be achieved.
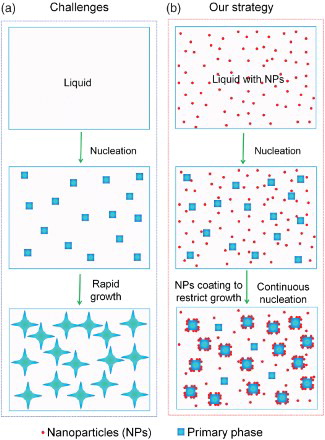
Figure 2. The morphology and structure of the Al phase and distribution of nanoparticles. (a–f) The morphology and structure of the Al phase in Sn–6.8Al with 0 (a–c) and 2 vol.% of TiC0.7N0.3 nanoparticles (d–f). Dark phases in (a), (b), (d) and (e) are Al, taken by an SE2 detector; (c) and (f) are EBSD images (different color indicates different grains). (g) SEM image of the interface region between primary aluminum and tin matrix in Sn–6.8Al with 2 vol.% of the TiCN nanoparticles sample, showing distribution of nanoparticles (NPs). The white circle highlights one nanoparticle inside the Al phase. To see nanoparticles clear, the image is taken by in-lens detector. (e) EDS spectrum of the particles in (g).
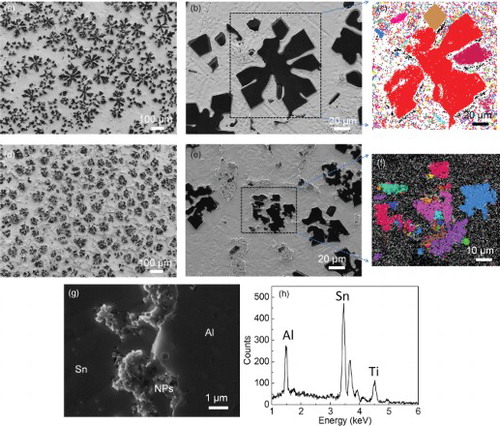
Figure 3. The morphology and size of the primary Al phase and distribution of nanoparticles in fast cooled samples. (a) The SEM image of pure Sn–6.8Al cooled at 20 K/s; (b,c) SEM images of Sn–6.8Al with 2 vol.% TiCN nanoparticles at low (b) and high (c) magnifications cooled at 20 K/s; (d) The SEM image of pure Sn–6.8Al cooled at 1000 K/s; (e) SEM images of Sn–6.8Al with 2 vol.% TiCN nanoparticles cooled at 1000 K/s. (f) The size of primary Al phase versus cooling rate. Since the distribution of nanoparticles and the size of the Al phase in the sample cooled at 1 K/s are uniform, there is no data point for less NPs region in (f).
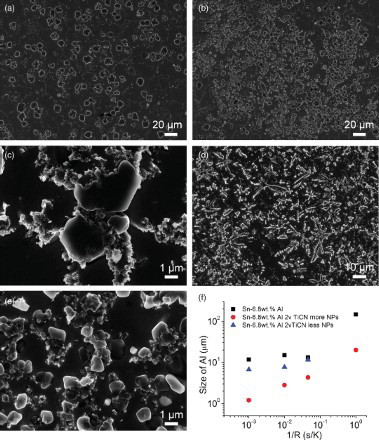
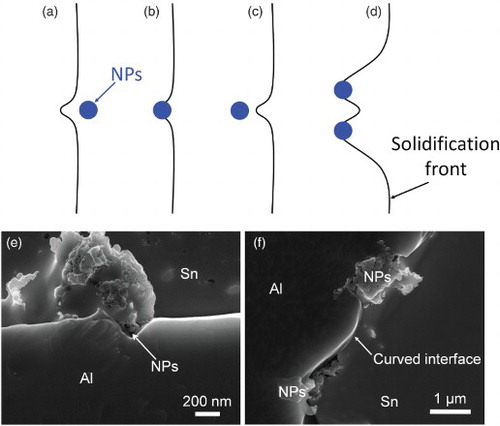
Figure 4. Mechanisms of growth restriction by nanoparticles. (a) Modifying temperature and/or solute concentration fields, (b) blocking diffusion, (c) increasing energy of growing phase, (d) step pining by the Gibbs–Thomson effect, (e) The SEM image of the concave surface of Al phase around nanoparticles, (f) The SEM image of curved surface between two nanoparticles.