Figures & data
Figure 1. SEM micrographs taken at various locations in the friction stir-processed region. The locations are marked along with the location of cross-section of the mini-tensile sample gage on the macro view of the processed region.
Figure 2. (a) The variation of hardness across the processed region on the transverse cross section and (b) the plastic stress–strain curves in both CG and FG conditions.
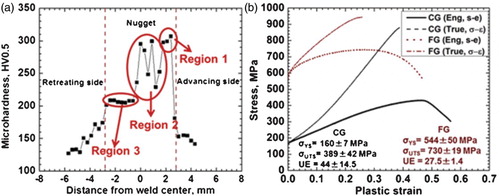
Figure 3. The variation of the work-hardening rate against the flow stress in both CG and FG conditions is shown. Note the difference in stage B of the two curves.
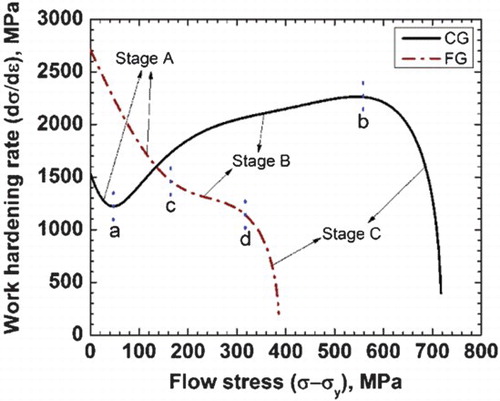
Figure 4. (a) TEM multi-beam bight field image of a deformed specimen showing the presence of twins in the CG material. (b) SEM surface micrograph showing the slip traces in the FG material after deformation to failure.