Figures & data
Figure 1. Loading functions for QS and creep tests. (a) A typical test to determine pop-in load or depth. (b) The pop-in test with check for elasticity used in this study. (c) A force modulation technique creep test.
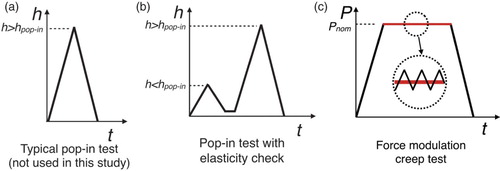
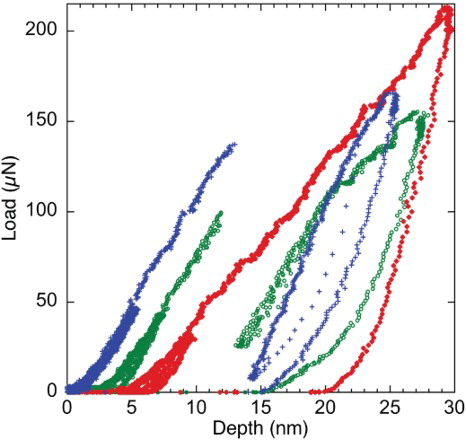
Figure 2. Typical QS curves from tests in Ir showing (1) completely elastic behavior prior to pop-in, (2) pseudo-Hertzian behavior prior to pop-in, and (3) gradual elastic-to-plastic transition with no pop-in (pseudo-Hertzian and plastic curves are depth offset for clarity).
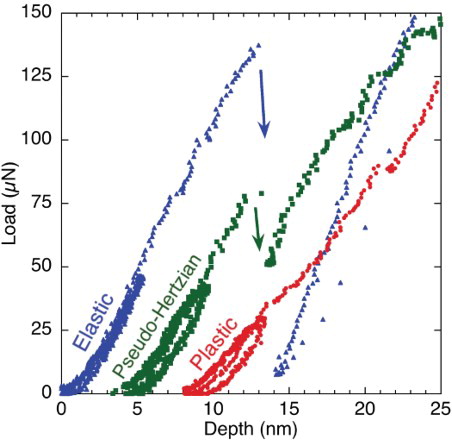
Figure 3. Relative fractions of material behavior from QS tests and creep tests.
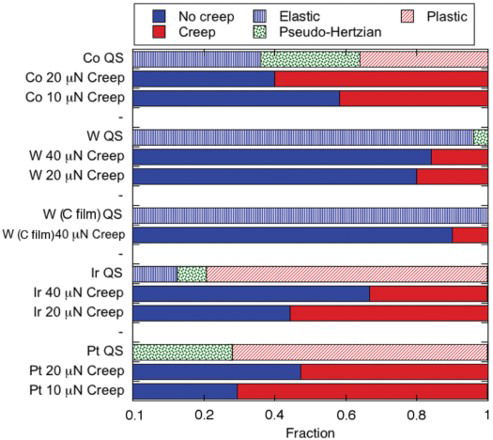
Figure 4. Typical contact stiffness and normalized stiffness versus time curves from the reference creep tests.
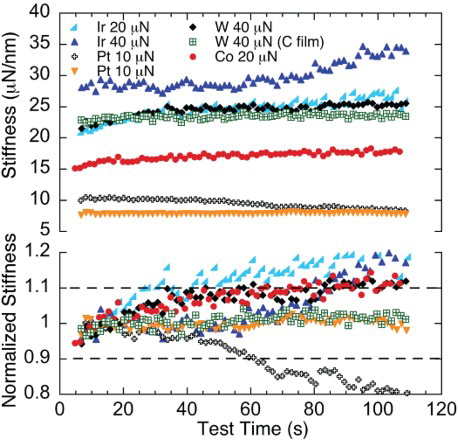
Figure 5. Load–depth curves in cobalt, displaying a weak trend between pop-in load and degree of plasticity recorded prior to pop-in (the two more-plastic curves are depth offset for clarity).