Figures & data
Table 1. Refined crystallographic parameters of (Cr0.5V0.5)n+1AlCn with n = 1, 2 or 3, at 300 K, as determined by the Rietveld analysis of neutron diffraction data.
Figure 1. Rietveld refinement of the structural models described in (solid red lines) to the 300 K ND data collected on the 3T2 diffractometer at λ = 1.225193(1) Å (open black circles), for the (Cr0.5V0.5)n+1AlCn samples with (a) n = 1, (b) n = 2 and (c) n = 3. The difference between model and experiment is presented by the dashed green line at the bottom of each diffractogram. The blue tags represent the reflections' positions of the phases used in the model, with the first line of tags belonging to the major MAX phase.
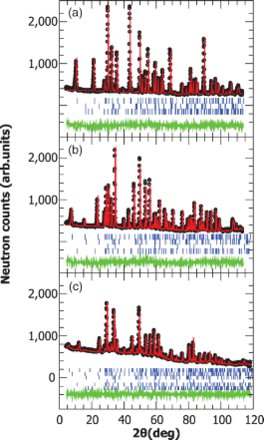
Figure 2. Crystal structure of the (Cr0.5V0.5)n+1AlCn compounds with n = 1 (left), n = 2 (middle) and n = 3 (right), visualized as a result of the Rietveld analysis of the 300 K ND data taken on 3T2. Refined layers’ distances are also given. For n = 2 and n = 3, a strong preferred occupation on the two (Cr,V) sites is observed. Reported (Cr,V) occupancies match the occupancies determined from the Rietveld analysis of the ND data (see also ).
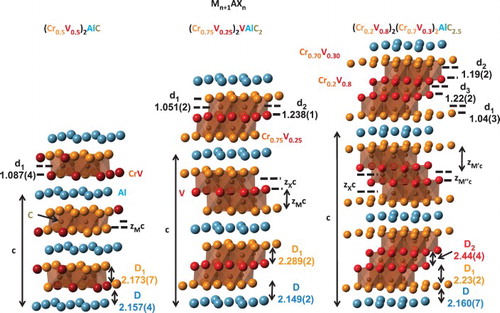
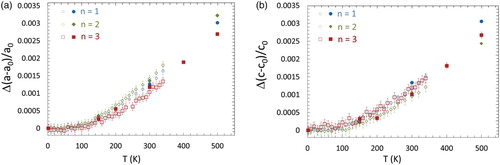
Figure 3. Thermal expansions of a (left) and c (right) lattice parameters in (Cr0.5V0.5)n+1AlCn as determined by the Rietveld analysis of temperature-dependent ND data, measured on G4.1 (open symbols) and 3T2 (filled symbols). When not being observed, uncertainties are smaller than symbols' size.