
Figures & data
Table 1. Data from literature to calculate Ω and δ.[Citation2,Citation11]
Figure 1. XRD pattern of as-milled alloy.
Figure 2. XRD pattern of uncontaminated alloy after annealing at 500°C.
Figure 3. (a) Bright field TEM image and diffraction pattern, (b) dark field image, and (c) grain size distribution of as-milled uncontaminated material.
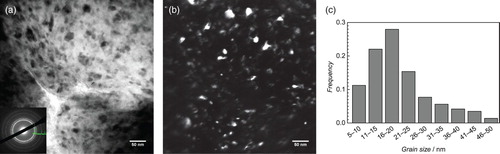
Table 2. Properties of alloys prepared.
Figure 4. Ashby plot of strength vs. density for engineering materials. (Yield strength for metals and polymers, tear strength for elastomers, compressive strength for ceramics,[Citation19] and tensile strength for composites.) Reproduced with permission from Elsevier 2010.[Citation20]
![Figure 4. Ashby plot of strength vs. density for engineering materials. (Yield strength for metals and polymers, tear strength for elastomers, compressive strength for ceramics,[Citation19] and tensile strength for composites.) Reproduced with permission from Elsevier 2010.[Citation20]](/cms/asset/63c4348b-ea31-4393-96aa-5a6ce00c7c3f/tmrl_a_985855_f0004_c.jpg)