Figures & data
Figure 1. HAADF STEM images showing the microstructure of Cu83.5Ag15W1.5 alloy following room-temperature irradiation. (a) The grain morphology; (b) the uniform distribution of W nanoparticles (indicated by small bright dots in the image).
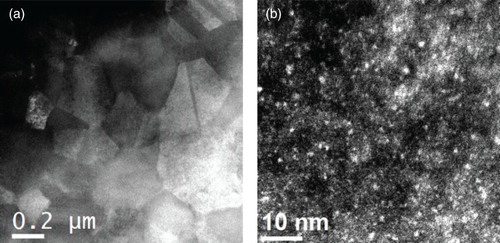
Figure 2. HAADF STEM images showing microstructural evolution during annealing following the room-temperature irradiation in Cu85Ag15 (a–d) and Cu83.5Ag15W1.5 (e–h): (a) 300°C for 0.5 h; (b) 300°C for 2 h; (c) 400°C for 1 h; (d) 500°C for 10 h; (e) 400°C for 1 h; (f) 400°C for 10 h; (g) 500°C for 10 h. The inset in (g) shows uniformly dispersed W nanoparticles in the Ag wetting layer. (h) 600°C for 10 h.
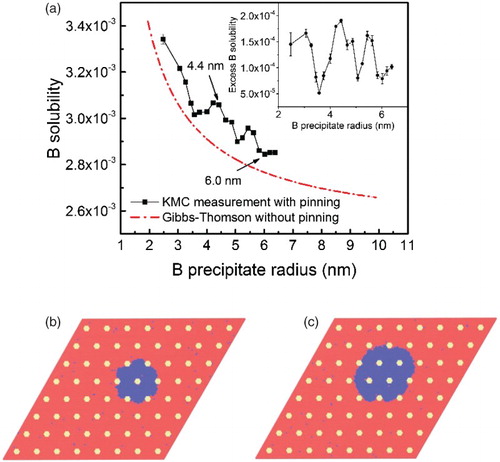
Figure 3. (a) Solid line: KMC measured solubility of B for the system with high-density C pinning particles. Dashed line: the solubility fitting using Gibbs–Thomson equation for the system without C pinning particles. The inset shows the solid line subtracted by the dashed line. (b) A slice of the microstructure of the system with an effective radius of r ≈ 4.4 nm (pointed by an arrow in (a)), showing a pinned B precipitate developing large positive and negative curvatures. (c) A slice of the microstructure of the system with an effective radius of r ≈ 6 nm (also pointed by an arrow in (a)), showing smaller curvatures. Red: A, blue: B, yellow: C.