
Figures & data
Figure 1. (a) XRD spectrums of aged pure Cu, Cu-2 wt.% Ag and Cu-6 wt.% Ag, data of standard power diffraction file of Cu and Ag are also given, Ag peaks are pointed out with red triangles, insert corresponding to the dotted rectangle shows the peak shift; optical images of aged (b) pure Cu, (c) Cu-2 wt.% Ag and (d) Cu-6 wt.% Ag; SEM images of aged (e) Cu-2 wt.% Ag and (f) Cu-6 wt.% Ag.
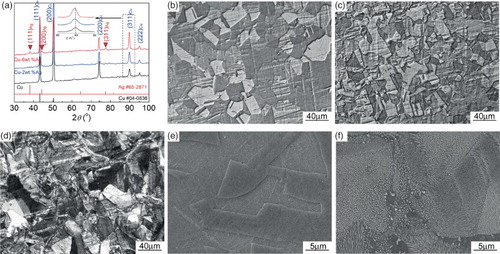
Figure 2. (a) Dependence of ultimate tensile strengths of Cu, Cu-2 wt.% Ag and Cu-6 wt.% Ag on drawing strain, and (b) strength differences between Cu-2 wt.% Ag and pure Cu, and Cu-6 wt.% Ag and Cu-2 wt.% Ag, the dash lines only guide for eyes.
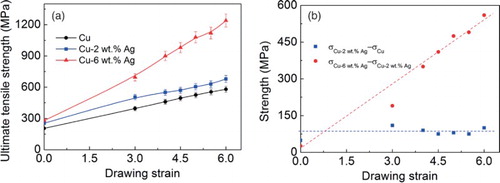
Figure 3. Bright-field TEM images of (a) Cu at η = 3.0 and (b) at η = 5.0, (c) Cu-2 wt.% Ag at η = 3.0 and (d) at η = 5.0, (e) Cu-6 wt.% Ag at η = 3.0 and (f) at η = 5.0, inserts are the SAED patterns, (g) dark-field TEM image corresponding to the white rectangle in (f) by using the reflection of (111)Ag.
Figure 4. (a) Schematic illustration of strengthening effect from each factor in Cu–Ag alloys and (b) experimental strengths of Cu-3 wt.% Ag [Citation27] and Cu-7 wt.% Ag [Citation13] at various drawing strains and predicted strengths by Equation (5).
![Figure 4. (a) Schematic illustration of strengthening effect from each factor in Cu–Ag alloys and (b) experimental strengths of Cu-3 wt.% Ag [Citation27] and Cu-7 wt.% Ag [Citation13] at various drawing strains and predicted strengths by Equation (5).](/cms/asset/0d5cd0c5-81bd-4181-9dbd-da299b3ef3b7/tmrl_a_1091795_f0004_c.jpg)