
Figures & data
Table 1. Summary of syntheses results. Dwelling times are given in the experimental section. In the last column, obtained phases are given in descending order with respect to their relative amount according to XRD and the MAX phases are rendered in bold. The compositions of the phases identified in this table are that of the closest matching with reference datasheets. For actual MAX phases compositions measured by EDX, refer to Table .
Table 2. Unit cell parameters of the produced Zr2(Al1-xAx)C quaternary MAX phases and comparison with existing ternary 211 MAX phases.
Figure 1. (Colour online) X-ray diffractograms of the powder samples obtained after heating the Zr2(Al0.5Sn0.5)C, Zr2(Al0.5Sb0.5)C and Zr2(Al0.5Pb0.5)C compositions to 1300°C for 10 h.
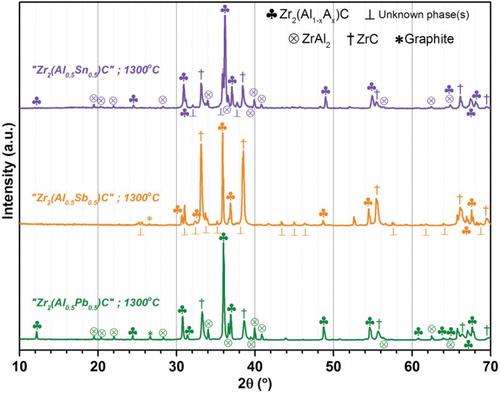
Figure 2. SEM images (secondary electron mode) of, (a) Zr2(Al0.2Sn0.8)C, (b) Zr2(Al0.3Sb0.7)C and (c) Zr2(Al0.35Pb0.65)C. In (a) according to EDX the shown grains only consist of Zr2(Al0.2Sn0.8)C (secondary phases present elsewhere). In (b) and (c) the darker contrast plate grains are respectively Zr2(Al0.3Sb0.7)C and Zr2(Al0.35Pb0.65)C, while the lighter surrounding grains are various secondary phases (see Table ). All images are for a reaction temperature of 1300°C (10 h dwelling).
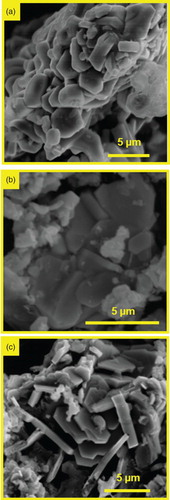
Figure 3. (Colour online) Lattice parameters a (top), c (middle) and unit cell volume V (bottom) variations in the Zr2(Al1-xSnx)C, Zr2(Al1-xSbx)C and Zr2(Al1-xPbx)C MAX phase systems as a function of x. Hollow symbols are for literature values (see Table for references). Zr2AlC values (x = 0) were selected from the most recent DFT calculation estimates [Citation14].
![Figure 3. (Colour online) Lattice parameters a (top), c (middle) and unit cell volume V (bottom) variations in the Zr2(Al1-xSnx)C, Zr2(Al1-xSbx)C and Zr2(Al1-xPbx)C MAX phase systems as a function of x. Hollow symbols are for literature values (see Table 2 for references). Zr2AlC values (x = 0) were selected from the most recent DFT calculation estimates [Citation14].](/cms/asset/b64b35c0-aa19-410a-9eb8-fe29bcad377d/tmrl_a_1143053_f0003_c.jpg)