
Figures & data
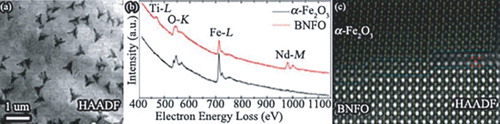
Figure 1. (Colour online) (a) ABF-STEM and (b) corresponding HAADF-STEM images of a cross-sectional sample showing the needle-shaped precipitates in the top of the BNFO film, as illustrated by the black arrows. (c) An HAADF-STEM image showing the position of a region of interest for the EDS line scan and (d) the corresponding composition profiles of Fe, Nd and Bi across the BNFO matrix and precipitate.
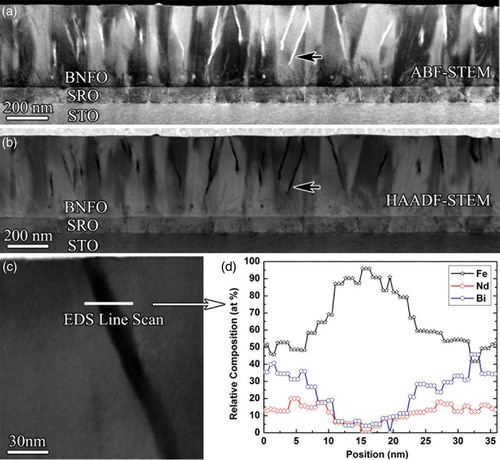
Figure 2. (Colour online) (a) HAADF-STEM and (b) corresponding ABF-STEM images of a plan-view sample with local enlarged images (insets) showing the dendritic as well as dispersed round-shaped precipitates in the surface of the BNFO film. (c) EELS spectra acquired from the BNFO matrix and precipitate, respectively. A reference spectrum of Fe2O3 from Gatan EELS Atlas is plotted for comparison.[Citation17]
![Figure 2. (Colour online) (a) HAADF-STEM and (b) corresponding ABF-STEM images of a plan-view sample with local enlarged images (insets) showing the dendritic as well as dispersed round-shaped precipitates in the surface of the BNFO film. (c) EELS spectra acquired from the BNFO matrix and precipitate, respectively. A reference spectrum of Fe2O3 from Gatan EELS Atlas is plotted for comparison.[Citation17]](/cms/asset/c670597f-100c-470a-a15b-455552b85a23/tmrl_a_1160260_f0002_c.jpg)
Figure 3. (Colour online) (a) Atomic-resolved HAADF-STEM and (b) corresponding ABF-STEM plan-view images showing the coherent growth of α-Fe2O3 and BNFO matrix. The red dash-lines are added as a guide to the eye to identify the change of the lattices across the BNFO matrix and precipitate. (c) The polyhedral model showing face and edge-sharing FeO6 octahedra of a α-Fe2O3 unit cell viewed along [241] zone-axis and (d) the corresponding projection of the unit cell. Oxygen anions are omitted and only Fe cations are shown for the sake of clarity. The black dash lines illustrate the dumbbell structure of the Fe–Fe cations in neighboring FeO6 octahedra.
![Figure 3. (Colour online) (a) Atomic-resolved HAADF-STEM and (b) corresponding ABF-STEM plan-view images showing the coherent growth of α-Fe2O3 and BNFO matrix. The red dash-lines are added as a guide to the eye to identify the change of the lattices across the BNFO matrix and precipitate. (c) The polyhedral model showing face and edge-sharing FeO6 octahedra of a α-Fe2O3 unit cell viewed along [241] zone-axis and (d) the corresponding projection of the unit cell. Oxygen anions are omitted and only Fe cations are shown for the sake of clarity. The black dash lines illustrate the dumbbell structure of the Fe–Fe cations in neighboring FeO6 octahedra.](/cms/asset/77fcfee6-6491-491a-8d01-cde0aed59755/tmrl_a_1160260_f0003_c.jpg)
Figure 4. Enlarged HAADF-STEM image of the lower right section of Figure (a) showing the atomic structure of the interface of α-Fe2O3 and the BNFO matrix. A structural model of the projection of a α-Fe2O3 unit cell viewed along [241] zone-axis is overlaid on the image for comparison. Only Fe cations are shown since oxygen anions are invisible in the HAADF image due to their weak scattering power. Yellow dash-dot-dot lines are added as a guide to the eye. Blue dash-dot-dot lines illustrate a transition zone with Bi-deficiency. Red arrows show additional atomic columns from a Nd-rich precipitate.
![Figure 4. Enlarged HAADF-STEM image of the lower right section of Figure 3(a) showing the atomic structure of the interface of α-Fe2O3 and the BNFO matrix. A structural model of the projection of a α-Fe2O3 unit cell viewed along [241] zone-axis is overlaid on the image for comparison. Only Fe cations are shown since oxygen anions are invisible in the HAADF image due to their weak scattering power. Yellow dash-dot-dot lines are added as a guide to the eye. Blue dash-dot-dot lines illustrate a transition zone with Bi-deficiency. Red arrows show additional atomic columns from a Nd-rich precipitate.](/cms/asset/2a834132-208a-45c1-bbc4-d10fc9f279f4/tmrl_a_1160260_f0004_c.jpg)