Figures & data
Figure 1. A schematic illustration of the in situ loading setup and the loading curve. The nonlinear loading curve with a large displacement includes the process of powder close packing. The nearly linear unloading curve presents the elastic deformation reversion, but the displacement is not fully recovered.
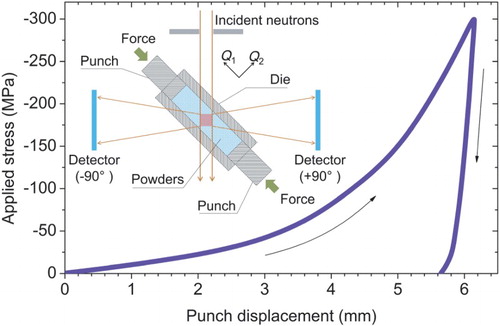
Figure 2. (a) Illustrations of {400}c peak fitting by applying the cubic structure model (Fdm) and the orthorhombic structure model (Fddd) respectively in the neutron diffraction patterns. The purple curves are the fitting residuals. At 0 MPa, both models seem applicable because the LMO lattice is close to cubic. At 300 MPa, the fitting confirms the orthorhombic structure of LMO. The Al peaks are due to the Al die. (b) The superlattice and MnO6 octahedra arrangement in the orthorhombic LMO. The Li and O atoms are omitted for simplicity. The gray arrows represent the distortion tendency of the Jahn–Teller effect at Mn(1), Mn(2) and Mn(3) sites respectively.
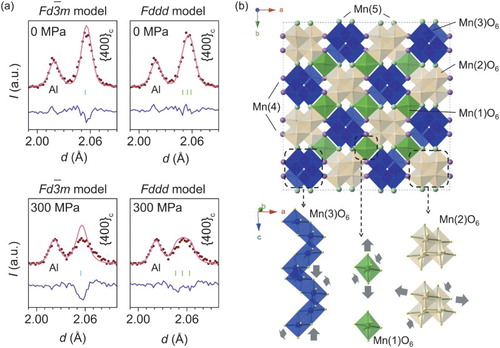
Figure 3. The lattice strains versus applied stress σ curves along the longitudinal direction (Q1). The loading leads to compressive strains along the a- and c-axes while a tensile strain along the b-axis. The lighter symbols present the data during unloading.
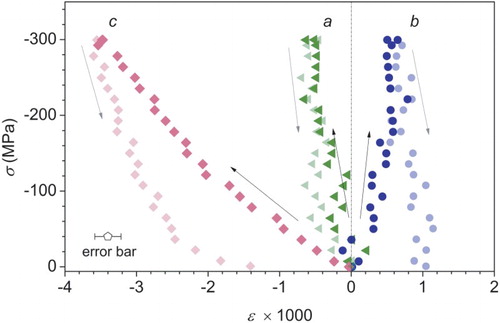
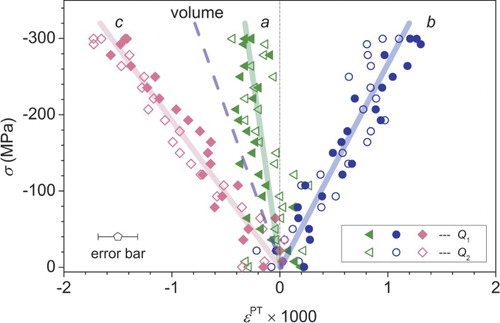
Figure 4. The phase transition strains PT in the orthorhombic lattice exhibit nearly linear dependence upon the applied stress σ, without anisotropic dependence upon the loading direction. The volume change rate is calculated through the linear fitting of the strains. The solid and open symbols present the data of longitudinal direction (Q1) and transverse direction (Q2), respectively.