Figures & data
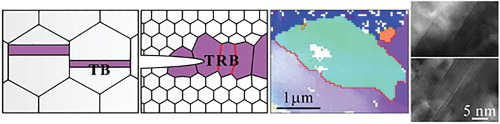
Figure 1. (a) Cross-sectional TEM image of the 930-nm-thick Au film on the polyimide substrate. (b) Plan-view TEM image of the Au film. (c) The XRD θ–2θ scanning result of Au films, revealing the strong (111) out-of-plane texture. (d) SEM observation of the damage morphology in the post-fatigued Au films.
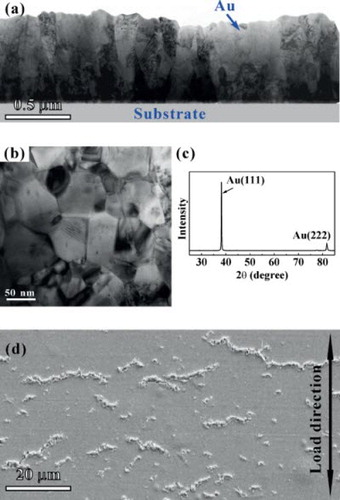
Figure 2. (a) EBSD orientation mapping of the cracked regions in the fatigued 930-nm-thick Au film. The white spots are areas with zero resolution. (b) and (c) Local magnification of the framed twinned areas in (a). The red lines present the TBs as indicated by the arrows. (d) TEM image of the coarsened grains along the cracks in the fatigued Au film. (e) TEM image of the typical grains with thin twin laminas in the fatigued Au film. (g) HRTEM image of the twinned area in (f). The twin relationship is marked by the solid line.
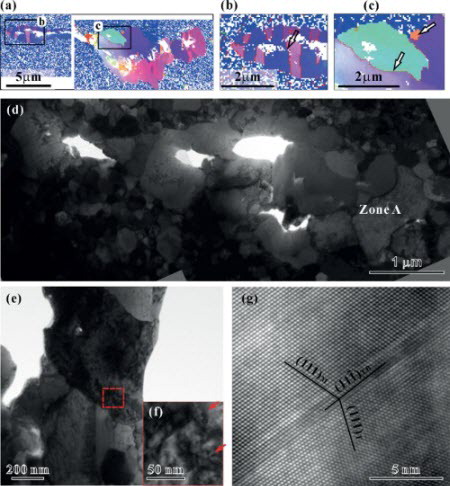
Figure 3. (a) Schematic illustration of positions of zone A and zone B in the cracked Au film after fatigue loading. Statistical distributions of normalized frequency of the misorientation angles of (b) the as-deposited films determined by EBSD and zone B in the fatigued Au film determined by TEM and (c) coarsened grains (zone A) determined by TEM and EBSD.
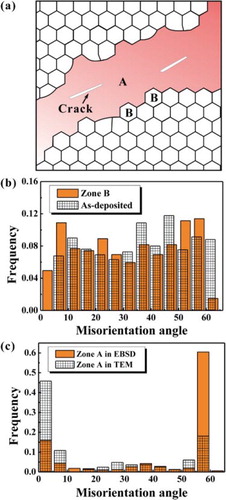
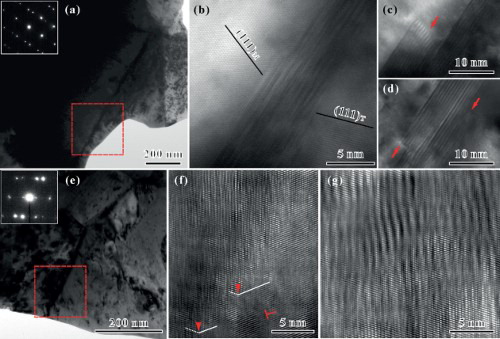
Figure 4. (a) and (e) TEM images of two typical large grains with the twin misorientation in the fatigued Au film. The insets in (a) and (e) are the corresponding selected-area electron diffraction pattern of the framed areas. (b–d) and (f, g) The corresponding details of the framed areas in (a) and (e), respectively. The long arrows in (c) and (d) indicate the boundary steps. The short arrows in (f) indicate the positions of the intersection between the boundary and the right grain. The dotted lines indicate the pane of the left grains. The twin relationship is marked by the solid line. A perfect dislocation is indicated by a symbol ‘⊥’.