
Figures & data
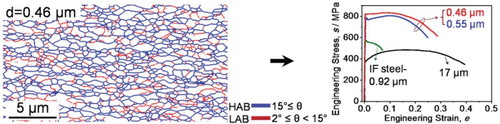
Figure 1. Schematic illustrations of the TMCP route-1 (a) and route-2 (b).
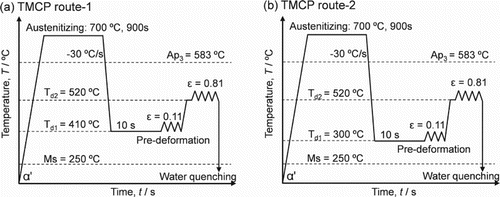
Figure 2. SEM images of the specimens water-quenched before pre-deformation (a,c) at 410°C (a) in the route-1, 300°C (c) in the route-2 and after pre-deformation at 410°C (b). (d) is an SEM image of the water-quenched specimen pre-deformed at 300°C and then isothermally held at 520°C for 4 s. F, M and TM indicate ferrite, martensite and tempered martensite, respectively. C.A. represents compression axis.
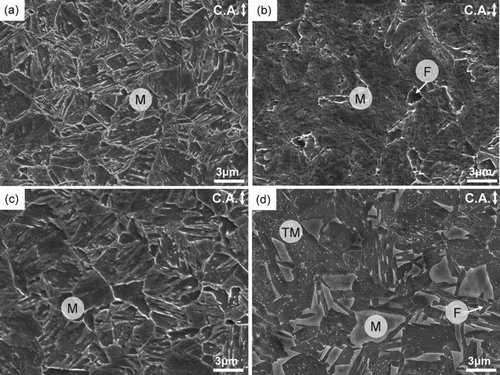
Figure 3. EBSD grain boundary maps of specimens processed in the TMCP route-1 (a) and route-2 (b). The LABs with misorientation of 2–15° and the HABs with misorientation above 15° are drawn in red and blue lines, respectively. (c) and (d) show distributions of boundary misorientation angles and ferrite grain sizes corresponding to (a,b).
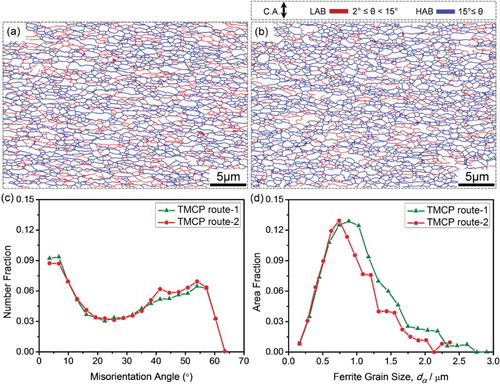
Figure 4. (a–c) Grain boundary maps of the specimens pre-deformed by 10% reduction at 410°C and further deformed to a reduction of (a) 5%, (b) 20% and (c) 50% at 520°C followed by water-quenching. The LABs and the HABs in (a–c) are drawn in red and blue lines, respectively. Non-ferrite phases (i.e. martensite and/or retained austenite) were painted in black. Compression axis in (a–c) is along the vertical direction of the maps. (d) is TEM image with misorientation map determined by Kikuchi-line analysis corresponding to (c). Blue solid lines and red dotted lines in (d) indicate HABs (above 15°) and LABs (below 15°), respectively. (e) Distribution of misorientation angle and (f) variations of ferrite volume fraction, fraction of HABs and fraction of DRX ferrite with straining are also shown.
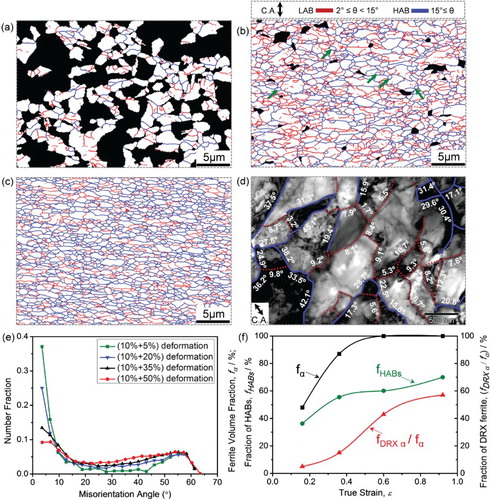
Figure 5. (a) Stress–strain curves of the statically transformed (grain size of 6.7 µm) ferrite for confirming the reliability of small-size specimen. (b) Stress–strain curves of the ultrafine-grained (0.46 µm and 0.55 µm) and coarse-grained (17 µm) ferrite in the present 10Ni-0.1C steel, compared with an IF steel (0.92 µm). (c) and (d) show the grain size dependence of the yield stress (c) and uniform elongation (d) for the ferrite structures obtained in the present study and reported in literatures.[Citation25–27]
![Figure 5. (a) Stress–strain curves of the statically transformed (grain size of 6.7 µm) ferrite for confirming the reliability of small-size specimen. (b) Stress–strain curves of the ultrafine-grained (0.46 µm and 0.55 µm) and coarse-grained (17 µm) ferrite in the present 10Ni-0.1C steel, compared with an IF steel (0.92 µm). (c) and (d) show the grain size dependence of the yield stress (c) and uniform elongation (d) for the ferrite structures obtained in the present study and reported in literatures.[Citation25–27]](/cms/asset/184e95e5-0c15-4dd3-9d11-5d96ea55bc2b/tmrl_a_1208301_f0005_c.jpg)