Figures & data
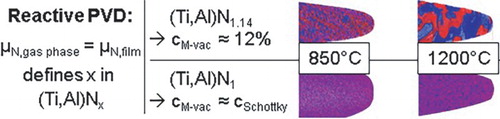
Figure 1. Schematics of reactive PVD. (a) Sputtering a metal target in poisoned mode. The reactive gas (here: N2) is inserted homogeneously into the chamber; on the metal target a nitride forms; the vapor that interacts with the film consists of metal and nitrogen atoms as well as a large amount of nitrogen molecules (inset). To date, there is no theory available that describes the nitrogen-to-metal ratio N/M of the thin film. (b) Combinatorial deposition setup using reactive gas gradients [Citation18]: the reactive gas is inserted at one end of the metal target. Close to the gas inlet, a nitride forms on the metal target and there is a large N2-partial pressure (upper inset). With increasing distance, the nitrogen partial pressure decreases and finally a metal is deposited (bottom inset). The stoichiometry and therefore concentrations of metal and nitrogen vacancies are continuously varied in the thin film.
![Figure 1. Schematics of reactive PVD. (a) Sputtering a metal target in poisoned mode. The reactive gas (here: N2) is inserted homogeneously into the chamber; on the metal target a nitride forms; the vapor that interacts with the film consists of metal and nitrogen atoms as well as a large amount of nitrogen molecules (inset). To date, there is no theory available that describes the nitrogen-to-metal ratio N/M of the thin film. (b) Combinatorial deposition setup using reactive gas gradients [Citation18]: the reactive gas is inserted at one end of the metal target. Close to the gas inlet, a nitride forms on the metal target and there is a large N2-partial pressure (upper inset). With increasing distance, the nitrogen partial pressure decreases and finally a metal is deposited (bottom inset). The stoichiometry and therefore concentrations of metal and nitrogen vacancies are continuously varied in the thin film.](/cms/asset/1705b1b7-5b1a-4c4a-b081-815f78d76b25/tmrl_a_1233914_f0001_c.jpg)
Figure 2. Theoretical results on energetics of defects and their mobility in (Ti,Al)Nx. (a) Energy of reaction according to Equation (1). (b) Chemical potential of nitrogen as a function of nitrogen concentration in (Ti,Al)Nx at 300°C. Chemical potential of nitrogen as N2 (gas) is included for 1 and 10−6 bar. Resulting equilibrium metal vacancy concentrations are indicated by grey lines. (c) Energy barrier for Ti and Al moving into an adjacent metal vacancy site in (Ti,Al)Nx. (d) Effective reduced diffusion constant for metal diffusion in (Ti,Al)Nx depending on stoichiometry and hence the metal vacancy concentration cM-vac.
Note: Dashed lines indicate how changing cM-vac from 2% to the Schottky defect concentration decreases diffusivity at 800°C and increases the temperature needed for the same diffusivity
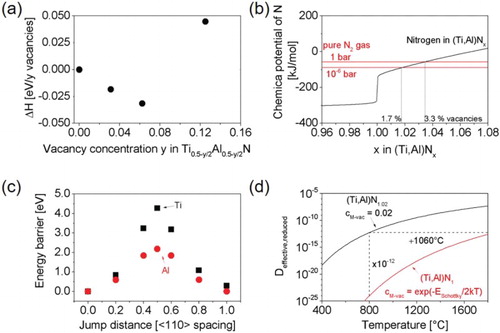
Figure 3. Deposition setup and resulting composition and mechanical properties. (a) The rectangular TiAl target and the N2 gas inlet installed at the short side, (b) chemical composition as a function of distance from the gas inlet and for the film deposited without gas gradient using a poisoned target (dashed lines) and (c) hardness and elastic modulus determined by nanoindentation for the samples characterized by their point defect concentration as function of temperature.
Note: The dashed lines indicate calculated elastic moduli of (Ti,Al)Nx with cM-vac = 12% (black), cM-vac = 0% (red), cN-vac = 12% (blue) (interpolated from data in reference [16])
![Figure 3. Deposition setup and resulting composition and mechanical properties. (a) The rectangular TiAl target and the N2 gas inlet installed at the short side, (b) chemical composition as a function of distance from the gas inlet and for the film deposited without gas gradient using a poisoned target (dashed lines) and (c) hardness and elastic modulus determined by nanoindentation for the samples characterized by their point defect concentration as function of temperature.Note: The dashed lines indicate calculated elastic moduli of (Ti,Al)Nx with cM-vac = 12% (black), cM-vac = 0% (red), cN-vac = 12% (blue) (interpolated from data in reference [16])](/cms/asset/134e1ad0-6376-4521-8f8f-a19d7124c6fd/tmrl_a_1233914_f0003_c.jpg)
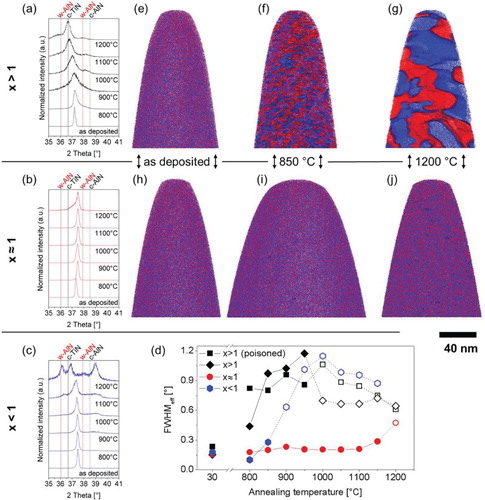
Figure 4. Structural evolution of (Ti,Al)Nx with different point defect concentrations after annealing. Diffractograms for (Ti,Al)Nx with x > 1 (a), x ≈ 1 (b), x < 1 (c). (d) Effective FWHM as measure for spinodal decomposition of the different films. Open symbols indicate the presence of a precipitated phase. Reconstructions of 3D-APT measurements of (Ti,Al)Nx x > 1 deposited using a poisoned target in the as-deposited state (e) and after annealing at 850°C (f) and 1200°C (g) and x ≈ 1 in the as-deposited state (h) and after annealing at 850°C (i) and 1200°C (j).
Notes: Ti atoms are shown in blue, Al atoms in red. Blue surfaces are isoconcentration surfaces that indicate regions with Ti/(Ti + Al) > 0.6, red surfaces indicate regions with Al/(Ti + Al) > 0.7