Figures & data
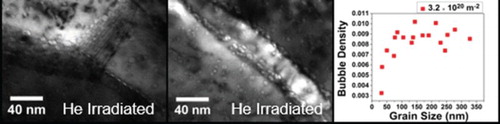
Figure 1. Plots of (a) average bubble density (number/nm2) vs grain size for the two different ion fluences showing a very similar trend; and (b) bubble density (number/nm2) vs grain size for the two different ion fluences with exponential decay fitting. (Fitting curves are and
for the 3.6 × 10¹⁹ and 3.2 × 10²⁰ ions m−2, respectively. Bright-field underfocus TEM images showing: nanocrystalline (NC) grains of size less than 35 nm adjacent to larger grains for (c) 3.6 × 10¹⁹ and (d) 3.2 × 10²⁰ ions m−2.
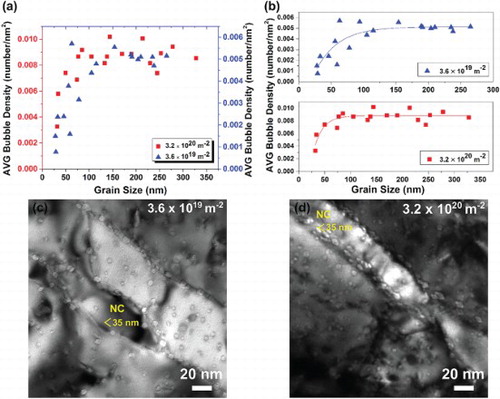
Figure 2. Plots showing (a) average bubble area (nm2) as a function of grain size for the two fluences; and (b) relative change in volume (Δv/v) for the two samples as a function of grain size with exponential decay fitting. (Fitting curves are and
for the 3.6 × 10¹⁹ and 3.2 × 10²⁰ ions m−2, respectively. Error bars in the average bubble size graph represent the standard error of the mean.
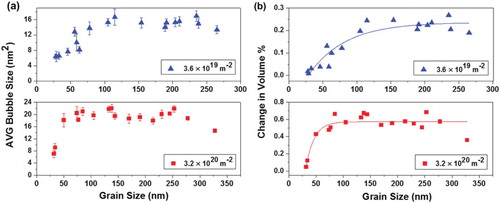
Figure 3. Bright-field underfocus TEM micrographs showing (a) and (b) samples irradiated to 3.6 × 10¹⁹ and 3.2 × 10²⁰ ions m−2, respectively, demonstrating the difference in bubble density and size at the grain boundaries (GB); and (c) a sample irradiated to 3.2 × 10²⁰ ions m−2 showing several grain boundaries decorated with different densities, shapes and sizes of bubbles. Please note the different scale in (a) and (b) compared to (c).
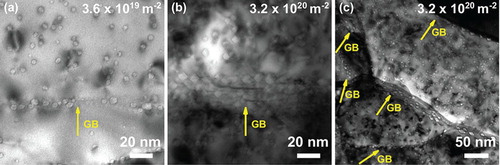
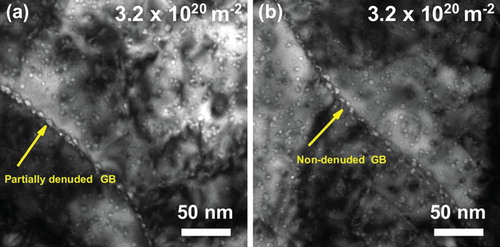
Figure 4. Bright-field underfocus TEM micrographs showing (a) the partially denuded and (b) the non-denuded grain boundaries at a fluence of 3.2 × 10²⁰ ions m−2.