Figures & data
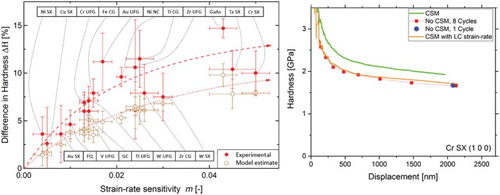
Table 1. Investigated material selection, covering face-centered cubic (FCC), body-centered cubic (BCC) and hexagonal closed packed (HCP) metals as well as FQ, GC and GaAs.
Figure 1. Comparison of hardness—displacement profiles for (a) Ni SX and (b) Cr SX for tests with and without CSM. Evidently, the different techniques result in significantly different H levels for Cr SX but not for Ni SX.
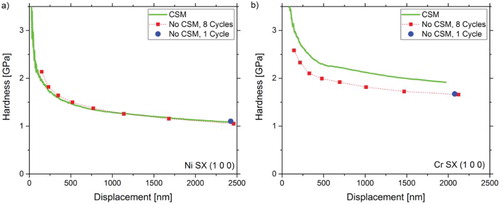
Figure 2. Load—displacement curves of LC (multiple unloading) and CSM measurements on Ni SX and Cr SX demonstrate that the hardness difference originates from the dwell segments of the LC tests (see the insets), while the plastic loading curves match up well.
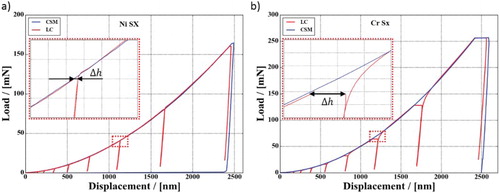
Figure 3. Development of the actual indentation strain-rate defined as , in contrast to the approximate solution
for a hold segment of a quasi-static indentation experiment. Evidently, the approximate
solution breaks down during constant load regimes.
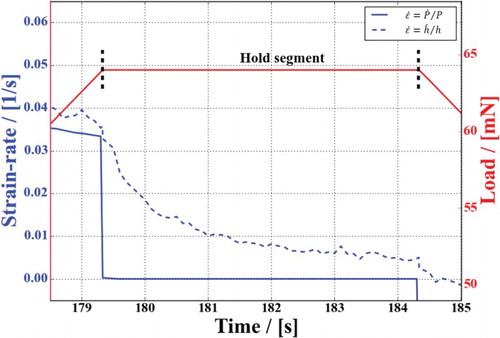
Figure 4. (a)–(c) Strain-rate profiles of three common nanoindentation techniques for Cr SX. The red circles indicate the range that can be used to obtain mechanical properties by the Oliver and Pharr analysis. Note that for dynamic (CSM) testing (c) the anticipated strain-rate is achieved, while for static (LC) tests (a, b) it differs by one order of magnitude.
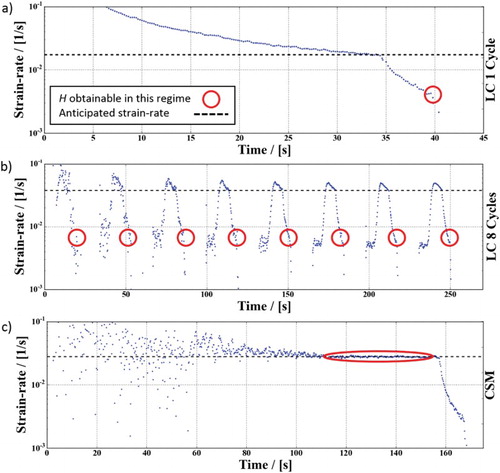
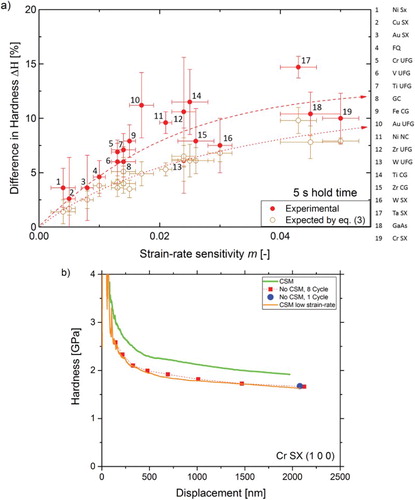
Figure 5. (a) Experimental and theoretical hardness difference as expected from Equation (3) between static and dynamic tests in dependence of the strain-rate sensitivity. (b) Low strain-rate CSM experiments confirm that the hardness difference is mainly rooted in differing strain-rates used to determine the hardness.