Figures & data
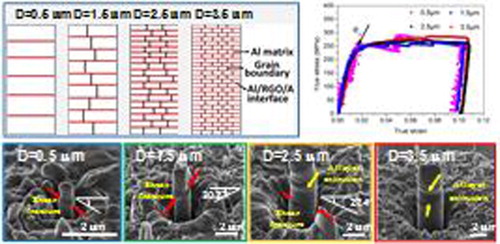
Figure 1. (a) Representative TEM image of the as-fabricated 0.5 vol.% RGO–Al nanolaminated composite, where the discontinuous RGO was marked out; (b) HRTEM image taken at the RGO/Al interface, where the various constituents were marked out and indicated by arrows.
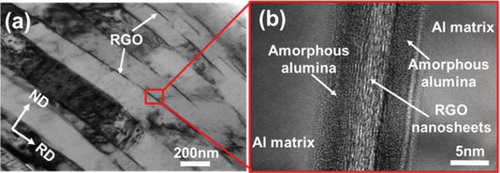
Figure 2. (a) Representative compressive true stress–strain curves for RGO–Al composite micro-pillars with varying diameters. The inset schematically demonstrates the microstructures of the composite pillars with different diameters, where the Al lamella shows a gradual transition from single crystal to polycrystalline when the pillar diameter increases from 0.5 to 3.5 µm. (b) Variation of average stress burst increment and strain hardening rate as a function of pillar diameter.
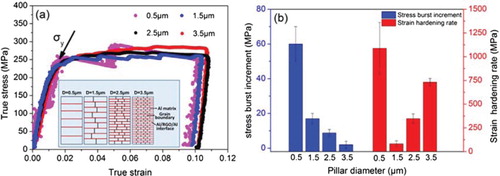
Figure 3. Typical SEM images of post-compression RGO–Al composite pillars with four different diameters (a) 0.5 µm, (b) 1.5 µm, (c) 2.5 µm and (d) 3.5 µm. The localized shear fracture is indicated by red arrows in (a), (b) and (c), while the extrusion of Al layer is indicated by yellow arrows in (c) and (d). Illustrative shear angle (the angle between the shear fracture plane and the pillar cross-section) estimates of post-compression pillar with local shear deformation are provided in (a)–(c). Insets show the corresponding SEM images of the RGO–Al composite pillars before compression.
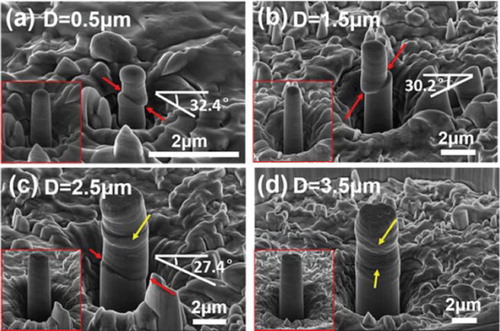
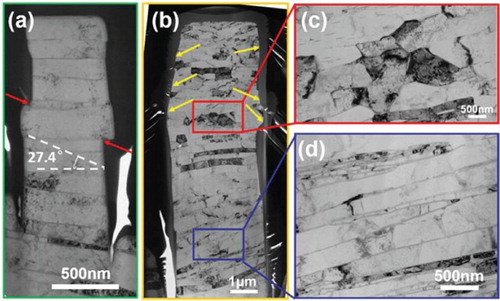
Figure 4. Representative TEM images of post-compression RGO–Al composite pillars. (a) and (b) show the morphologies of the entire pillars with diameters of 0.5 and 3.5 µm, respectively. (c) and (d) are magnified renditions of the regions boxed in (b). The localized shear fracture was indicated by red arrows in (a), while the extrusion of Al layer was indicated by yellow arrows in (b).