Figures & data
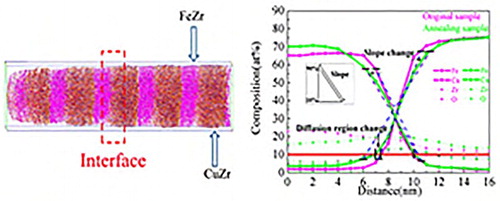
Figure 1 (a) A typical XRD pattern of the Fe75Zr25/Cu64Zr36 amorphous multilayers. (b) An HRTEM image of the multilayer sample. The different composition layers were evidenced by their different contrasts. The inset of (b) is the SAED pattern.
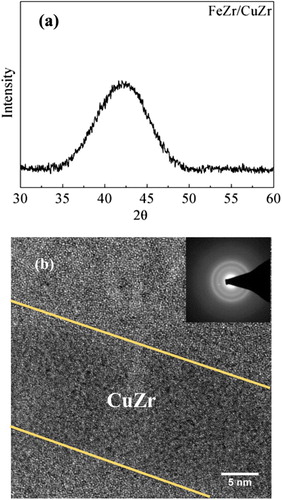
Figure 2 (a) The APT reconstruction of the Fe75Zr25/Cu64Zr36 amorphous multilayers. (b) The concentration profiles of the multilayers.
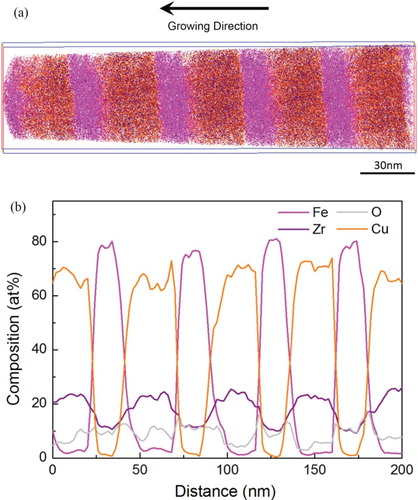
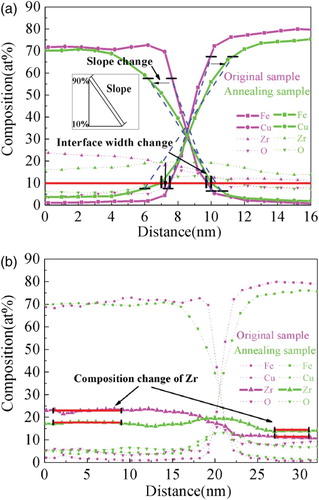
Figure 3 The elements concentration profiles of the Fe75Zr25/Cu64Zr36 amorphous multilayers before and after annealing. The statistical data are acquired from 103 concentration profiles obtained by analysis cylinders with 5 nm in diameter at the CuZr/FeZr interfaces. (a) The inter-diffusion analysis of immiscible elements Fe and Cu. The inter-diffusion length is defined as the distance from concentration 10 at% Cu to 10 at% Fe. The slope was calculated from the concentration profiles of both elements, taking into account the variation between ∼10 and 90 at% of the respective concentration amplitude. The interface width expanded from 2.3 ± 0.2 to 2.6 ± 0.3 nm. The slope of Cu concentration profile was found to decrease from 21.7 ± 1.7 (initially) to 15.4 ± 3.5 (annealed), and the slope of Fe decreased from 23.7 ± 2.0 (initially) to 11.5 ± 2.6 (annealed). (b) The inter-diffusion analysis of Zr. Zr diffused from CuZr (Zr-rich) to FeZr (Zr-poor) and finally the concentration was almost the same everywhere.