Figures & data
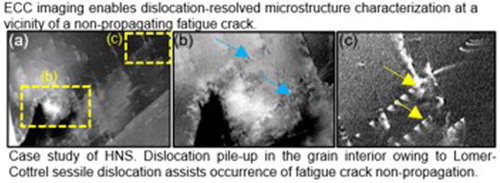
Table 1. Chemical compositions of the materials used in this study (mass%).
Figure 1. Engineering stress–strain curves of the Fe-18Cr-14Ni and Fe-25Cr-1N steels.
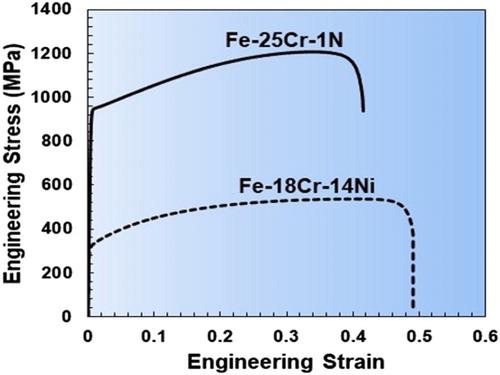
Table 2. 0.2% proof stress, tensile strength, and elongation of the Fe-25Cr-1N and Fe-18Cr-14Ni steels.
Figure 2. Fatigue crack length plotted against number of cycles.
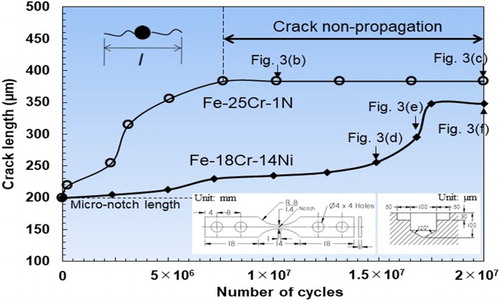
Figure 3. (a–c) Replica images of the Fe-25Cr-1N steel during the fatigue test at 275 MPa, (d–f) replica images of the Fe-18Cr-14Ni steel at 100 MPa. The red dashed lines indicate the positions of the crack tips. The insets are magnified images of the regions in correspondence of the crack tips.
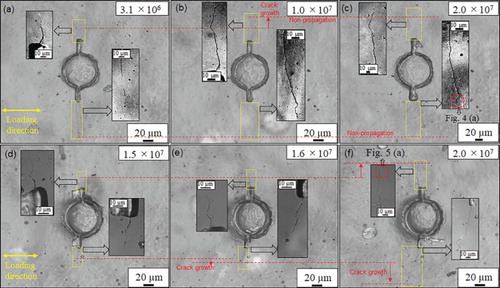
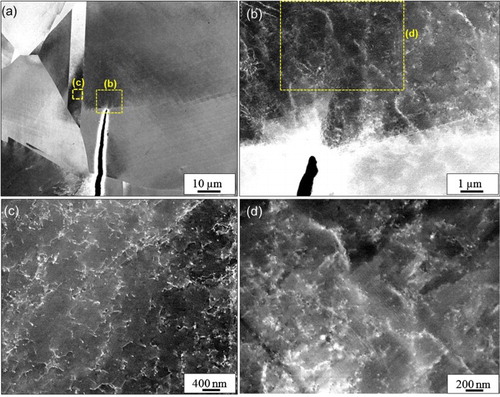
Figure 4. Electron channeling contrast (ECC) images of the Fe-25Cr-1N steel: (a) Dislocation structure at the crack tip corresponding to the crack tip outlined by the red dashed lines in Figure (c), (b), (c), and (d) magnified images of the regions outlined by the dashed lines in Figure (a) and (b). The blue and yellow arrows indicate the prevention of the dislocation motion at the intersections of two slip systems for each location shown in Figure (c and d). The normal and tensile direction (//RD) in the grain surrounding the crack tip are and
respectively.
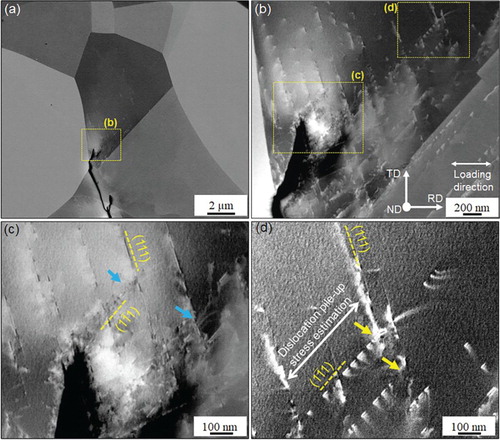
Figure 5. Electron channeling contrast (ECC) images of the Fe-18Cr-14Ni steel: (a) Dislocation structure at the crack tip corresponding to the crack tip outlined by the red dashed lines in Figure (f), (b and c) magnified images of the regions outlined by the dashed lines in Figure (a) and (b).