Figures & data
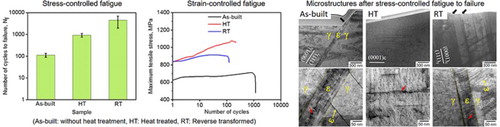
Figure 1. Schematic drawing of (a) cylindrical rods fabricated by the EBM process and (b) dog-bone-shaped specimen for fatigue tests.
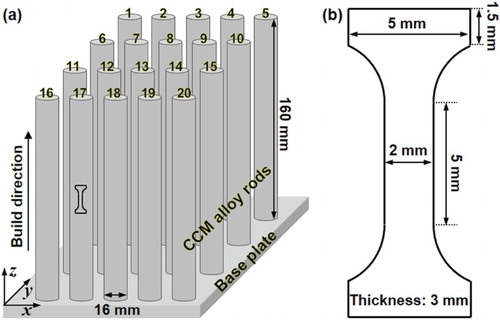
Figure 2. (a–f) EBSD phase maps and inverse pole figure (IPF) maps of as-EBM built (a and b), heat-treated (c and d) and reverse-transformed (e and f) specimens of biomedical Co–Cr–Mo alloy prior to fatigue tests. (g) The corresponding average grain sizes and fcc phase fractions.
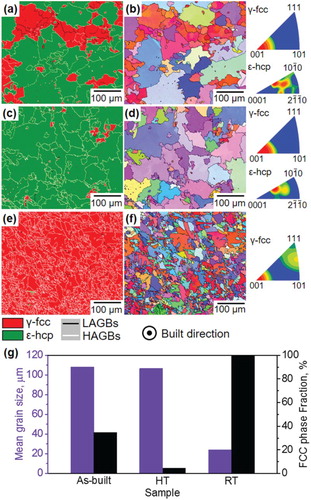
Figure 3. (a) Number of cycles to failure of stress-controlled fatigue tests and (b) maximum tensile stress of strain-controlled fatigue tests of as-EBM built, heat treated and reverse-transformed CCM alloys.
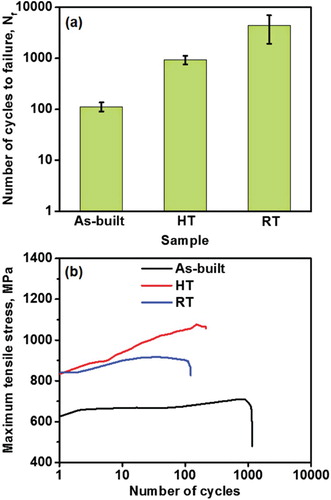
Figure 4. SEM images showing fracture surface (a–c) and side surface (d–f) of as-EBM built (a and d), heat-treated (b and e) and reverse-transformed (c and f) samples after stress-controlled fatigue to failure; (g–i) magnified view of (d–f). The view direction is either parallel (a–c) or perpendicular (d–i) to the stress-loading axis in fatigue tests.
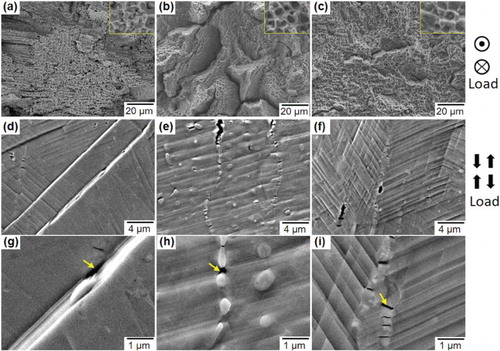
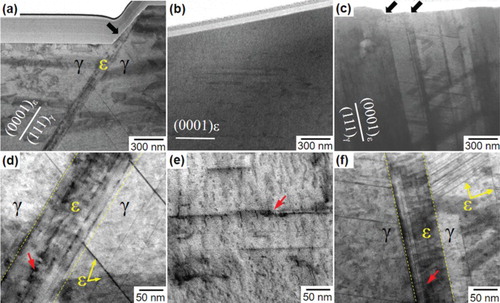
Figure 5. STEM images showing microstructures of as-EBM built (a and d), heat-treated (b and e) and reverse-transformed (c and f) samples after stress-controlled fatigue to failure; (d–f) magnified view of (a–c). The incident beam is parallel to {111}γ//(0001)ϵ.