Figures & data
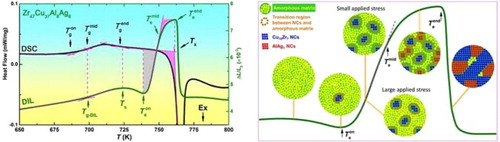
Figure 1. DSC and DIL traces of (a) Zr43Cu41Al8Ag8 and Zr47Cu37Al8Ag8 BMGs.
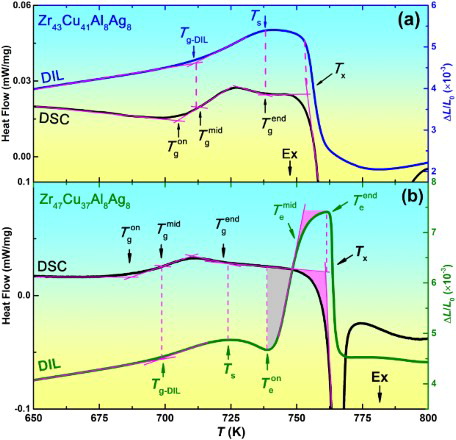
Figure 2. (a) DIL traces of Zr43Cu41Al8Ag8 and Zr47Cu37Al8Ag8 BMGs heating to different temperatures and (b) XRD patterns of water-cooled samples.
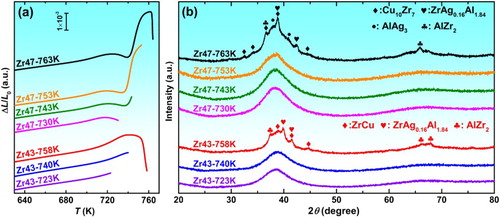
Figure 3. HRTEM and selected-area electron diffraction of the water-cooled samples.
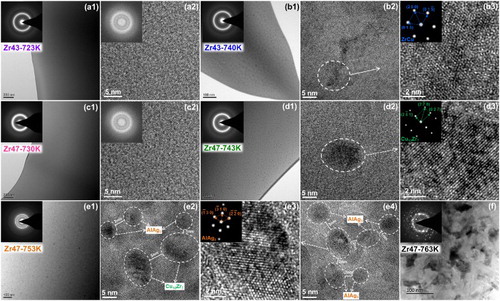
Table 1. Room temperature densities of the as-cast samples, samples fast cooled from different temperature, and ZrCu, Cu10Zr7 and AlAg3 crystals according to the powder diffraction file (PDF) database.
Figure 4. (a1, a2, b1, b2) Colored STEM images and (a3, b3) the change of total characteristic spectral X-ray photon counts along the linear scanning direction of Zr43-740 K and Zr47-743 K samples. (b4) The relative atomic percentage change in the transition region from the nano-crystal Cu10Zr7 to the amorphous phase in the Zr47-743 K sample.
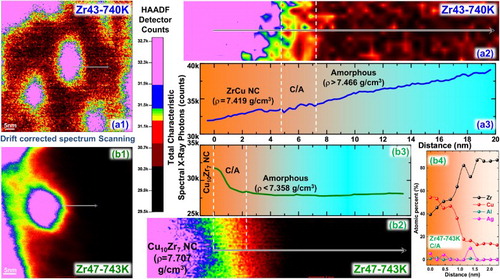
Figure 5. Thermal expansion traces of Zr47 with different dimensions. The corresponding instrument applied compressive stresses of 0.03–0.3 MPa.
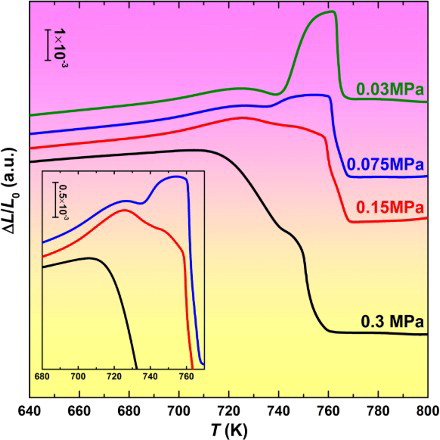
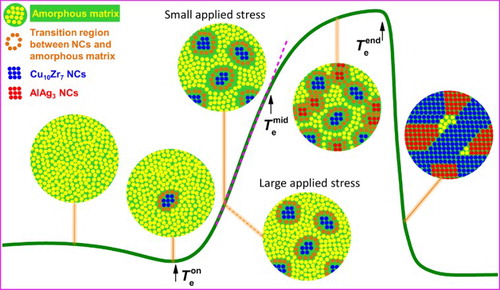
Figure 6. The sketch of the microstructural evolutions behind the anomalous expansion.