Figures & data
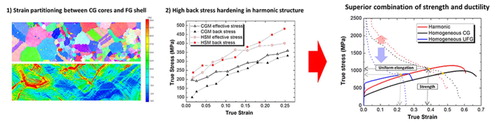
Table 1. Chemical composition of manufactured SUS304L powders (mass %).
Figure 1. (a) IPF EBSD map of SUS304L HSM, and a magnified map of the shell region. (b) The bimodal grain size distribution of HSM. (c) Engineering stress-strain curves of bulk SUS304L with various microstructures.
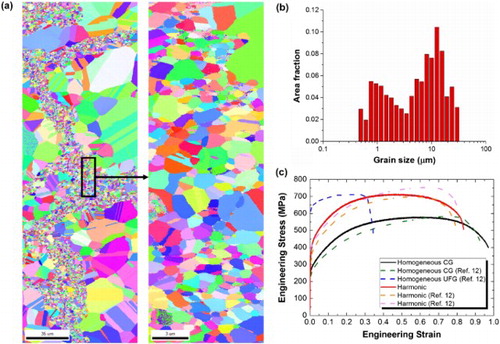
Figure 2. (a) EBSD IPF map of SUS304L HSM at the initial state. The red boxes refer to the regions where DIC analysis was conducted after 10% elongation. (b) Equivalent plastic strain distribution of HSM after 10% elongation, calculated by the DIC analysis. (c) The schematic diagram of HSM microstructure and dislocation generations. (d) Strain profile along the path, which exhibits strain peaks near core-shell boundaries.
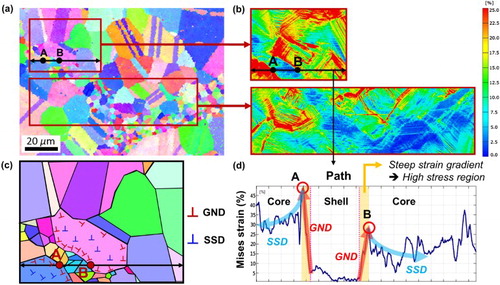
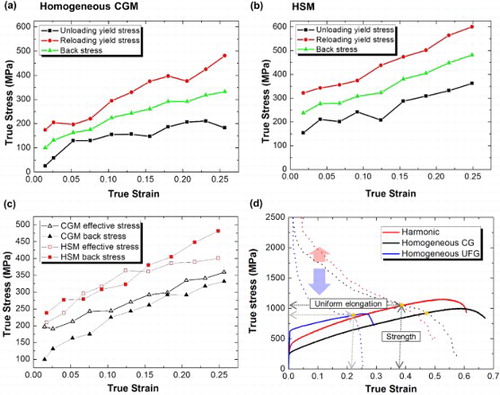
Figure 3. The unloading-reloading loops for (a) homogeneous CGM and (b) HSM. Each loop is fitted as a polynomial function, and the yield point is defined as the point which has a 10% reduction in slope from the effective elastic modulus.
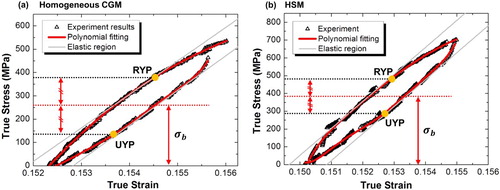
Figure 4. The back stress measured using the unloading-reloading test for (a) homogeneous CGM and (b) HSM. The HSM exhibits a higher back stress than the homogeneous CGM over the whole strain range. (c) Comparison between back stress and effective stress for HSM and CGM. (d) The strain hardening rates for harmonic and homogeneous structures. The higher strain hardening rate due to back stress hardening in the HSM expands the uniform elongation.