Figures & data
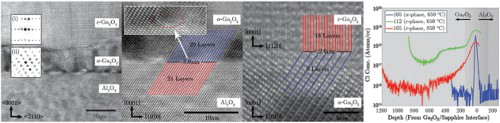
Table 1. Crystal parameters for α-Ga O, β-GaO, and ϵ-GaO [Citation5,Citation23,Citation24].
Table 2. Summary of epitaxial growths of α- and ϵ-GaO reported in the literature.
Figure 1. XRD of (a) β, (b) α, and (c) ϵ-phases. Growth conditions are shown in Table .
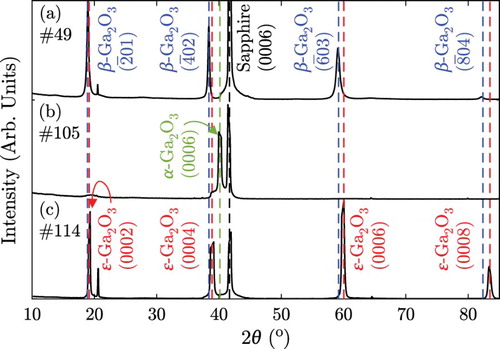
Table 3. Growth conditions for β, α, and ϵ-GaO films corresponding to the XRD patterns shown in Figure (a)–(c), respectively.
Figure 2. SEM images showing a series of heteroepitaxial GaO
films having respective sample #s 86–89 and grown by HVPE on c-plane sapphire. The Ar and O
flow rates are indicated. The inset of (b) shows a magnified image of the hexagonal islands achieved under these particular conditions; they were also present in the film shown in (a). (e) XRD of samples shown in (a)–(d), respectively.
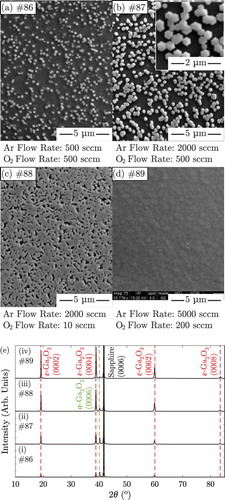
Figure 3. (a) Cross-section TEM of β-GaO
epitaxial layer grown by MOCVD on sapphire (0001) at 650
C. The epitaxial relationship is [
01] β-Ga
O
[0001] α-Al
O
. (b) Cross-section HRTEM of Ga
O
on c-plane sapphire along the Al
O
[
] zone axis (sample #89). An ∼10nm thick interfacial layer of α-Ga
O
grew directly on the substrate, followed by a thicker layer of ϵ-Ga
O
. Insets shows selected area diffraction corresponding to (i) ϵ-Ga
O
[
] and (ii) α-Ga
O
[
]. The epitaxial relationship was found to be [
] ϵ-Ga
O
[
] α-Ga
O
[
] α-Al
O
. (c) Cross-section HRTEM of α-Ga
O
on c-plane sapphire along the α-Al
O
[
] zone axis. Inset is magnified image of misfit dislocation. (d) Cross-section HRTEM of ϵ-Ga
O
on α-Ga
O
along the α-Ga
O
[
] zone axis.
![Figure 3. (a) Cross-section TEM of β-GaO epitaxial layer grown by MOCVD on sapphire (0001) at 650C. The epitaxial relationship is [01] β-GaO [0001] α-AlO. (b) Cross-section HRTEM of GaO on c-plane sapphire along the AlO [] zone axis (sample #89). An ∼10nm thick interfacial layer of α-GaO grew directly on the substrate, followed by a thicker layer of ϵ-GaO. Insets shows selected area diffraction corresponding to (i) ϵ-GaO [] and (ii) α-GaO []. The epitaxial relationship was found to be [] ϵ-GaO [] α-GaO [] α-AlO. (c) Cross-section HRTEM of α-GaO on c-plane sapphire along the α-AlO [] zone axis. Inset is magnified image of misfit dislocation. (d) Cross-section HRTEM of ϵ-GaO on α-GaO along the α-GaO [] zone axis.](/cms/asset/7665d23f-ea11-488c-8adc-fcdf23bc53ee/tmrl_a_1443978_f0003_c.jpg)
Figure 4. (a) XRD of α-GaO
grown on c-plane sapphire before and after annealing at 700
C for 1 h. Insert shows an optical image of the surface microstructure of the β-Ga
O
that transformed from the α-Ga
O
after annealing at 700
C for 1 h. (b) XRD of ϵ-Ga
O
grown on c-plane sapphire before and after annealing at 1000
C for 1 h.
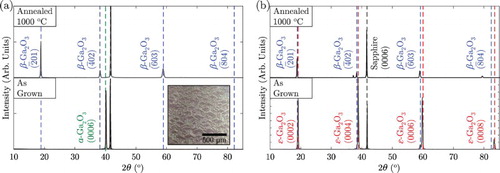
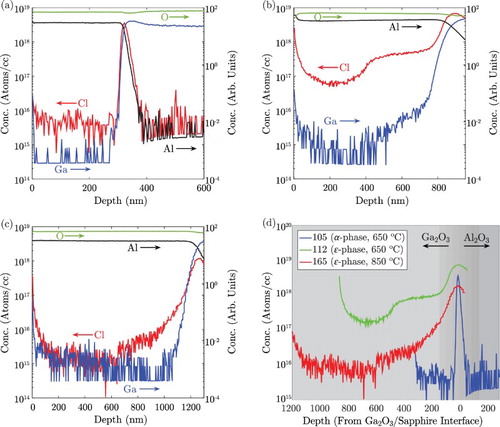
Figure 5. Cl− concentration in atoms/cc and Ga, Al and O concentration in arbitrary units, measured by SIMS for samples (a) #105, (b) #112, and (c) #165, respectively. (d) Cl− concentration in three samples measured by SIMS. Sample #105 shows α-phase and was grown at 650C, sample #112 shows ϵ-phase and was grown at 650
C. Sample #165 shows ϵ-phase and was grown at 850
C.