Figures & data
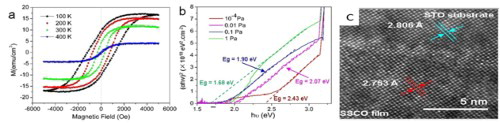
Figure 1. (a) XRD patterns and (b) AFM images of SSCO films on STO (001) substrate with varied PO2. The intensity was in the logarithmic form. The inset of (a) indicated the shift of (001) peak.
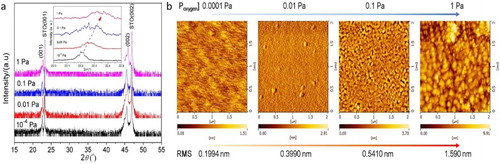
Figure 2. (a) TEM image, (b) selective area electron diffraction pattern and (c) electron dispersive spectrum spectrum of SSCO films on STO (001) substrate (0.1 Pa); (d) high-resolution TEM image of the interface between SSCO films on STO substrate, with the insets illustrating the fast fourier transformation patterns of the red rectangle area in substrate and in film; (e) enlarged view of the film–substrate interface; (f) typical polycrystalline SrCoOx particle embedded in the epitaxial film.
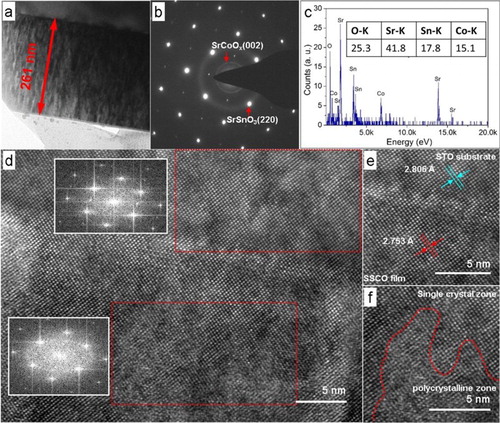
Figure 3. XPS spectra of element (a) Co and (b) O in SSCO film and SrSnO3 films (oxygen pressure: 0.1 Pa). The color lines were fitting curves of Co 2p peaks and dash lines were fitting curves of O1s peaks. The charge shifted spectra were corrected using the adventitious C 1s photoelectron signal at 284.6 eV.
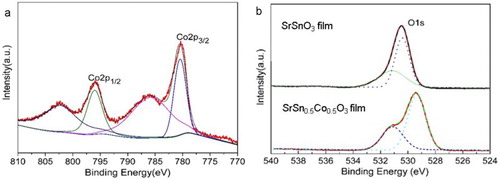
Figure 4. Magnetic hysteresis loops of SSCO film deposited at oxygen temperature of (a) 0.1 Pa and (b) 1 Pa on STO (001) substrate. The diamagnetic signals from the STO substrate were subtracted.
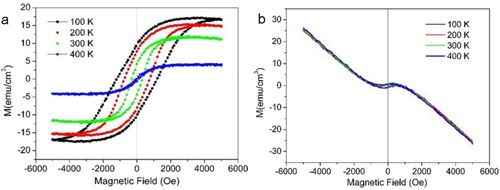
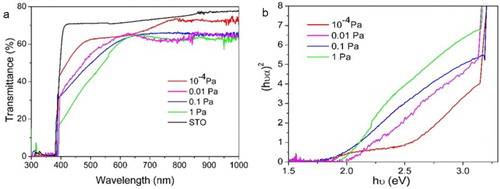
Figure 5. (a) Optical transmittance and (b) (αhν)2∼hν curves of SSCO film on STO (001) substrate deposited at different oxygen temperatures.