
Figures & data
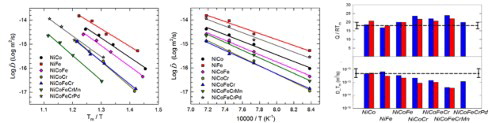
Figure 1. (a–g) Concentration profiles of diffusion couples annealed at 1070°C; the solid lines are CALPHAD simulations; (h) backscattered electron image and EDX scan for (f).
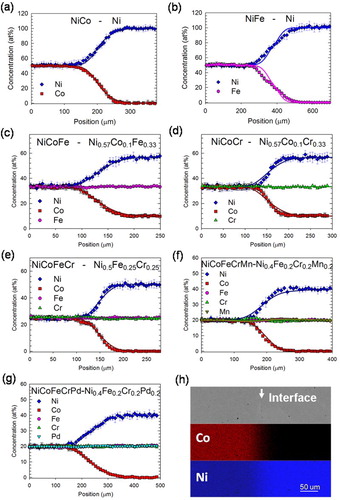
Figure 2. Concentration-dependent interdiffusion coefficient of the NiCoCr diffusion couples.
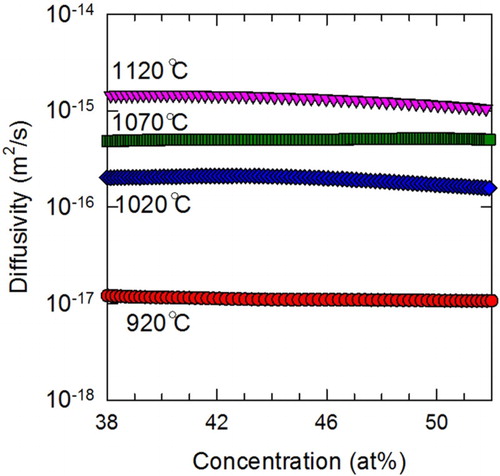
Figure 3. Diffusion coefficients as a function of homologous temperature. The lines in (a) are linear fits of experimental data; those in (b) are the Ni tracer diffusivities from CALPHAD simulations.
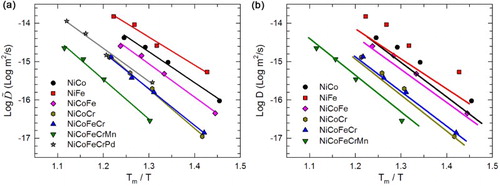
Table 1. Diffusion parameters for the alloys. The melting temperatures for NiCoFeCrPd are determined using differential scanning calorimeter measurements, and that for the others are from Wu et al. [Citation20].
Figure 4. Interdiffusion coefficients as a function of absolute temperature.
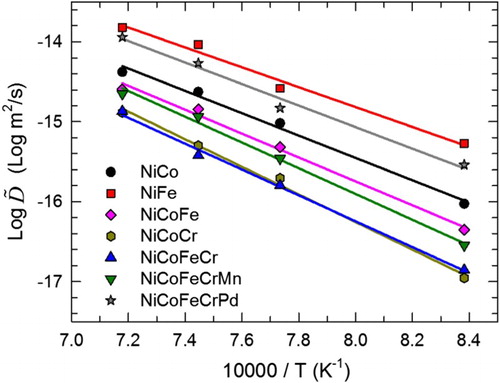
Figure 5. (a) Normalized activation energy and (b) melting temperature diffusivity of the tested alloys. The left bars are experimental data, and the right bars are CALPHAD results. The dash lines are the averaged values from Ref. [Citation30]. (c) Correlation between the pre-factor and the normalized activation energy; up triangle, round, and down triangle symbols are from the data in References [Citation14,Citation16,Citation22], respectively.
![Figure 5. (a) Normalized activation energy and (b) melting temperature diffusivity of the tested alloys. The left bars are experimental data, and the right bars are CALPHAD results. The dash lines are the averaged values from Ref. [Citation30]. (c) Correlation between the pre-factor and the normalized activation energy; up triangle, round, and down triangle symbols are from the data in References [Citation14,Citation16,Citation22], respectively.](/cms/asset/9803a8a0-b78c-413b-a0a2-43c28a1bd2b2/tmrl_a_1446466_f0005_c.jpg)