Figures & data
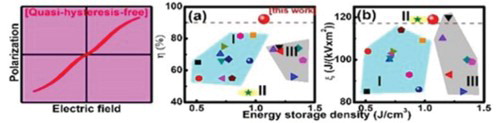
Figure 1 (a) XRD patterns of the 0–2 Mn ceramics, and the inset shows the SEM microstructure for 1 Mn ceramic morphology; (b) the Weibull plots of dielectric BDS of the 0–2 Mn ceramics and (c) temperature dependence of dielectric constant (εr) and loss (tan δ) at frequency of 1 kHz.
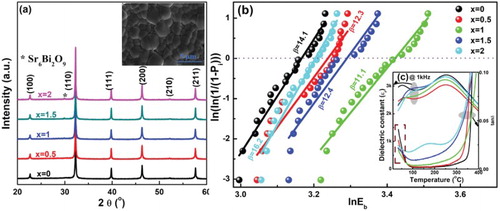
Figure 2. (a–e) Complex impedance plots for 0–2 Mn ceramics in the temperature range of 470–580°C (the dots are experimental data and the solid lines represent the fitting results); (f) equivalent circuit proposed for impedance data fitting; (g) Arrhenius-type plots of the conductivity with temperature and (h) variation of activation energy Ea as a function of the Mn content.
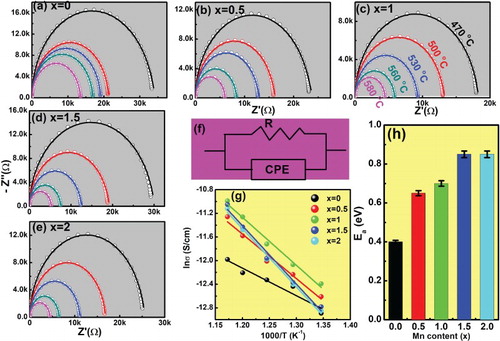
Figure 3. (a–b) Z′′ and M′′ spectrum for 1 Mn ceramics over 470–580°C; comparison of (c) complex impedance plots at 470°C and (d) normalized Ea for 1 Mn ceramics in nitrogen, air and oxygen atmospheres.
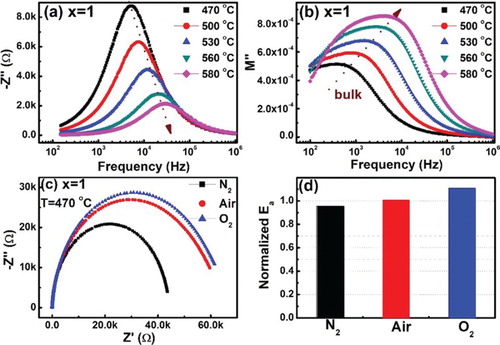
Figure 4. (a) RT X-band EPR spectra for 0–2 Mn ceramics, the inset shows the XPS of 1 Mn ceramic and (b and c) schematic illustration of defect structure of Mn-doped ceramics.
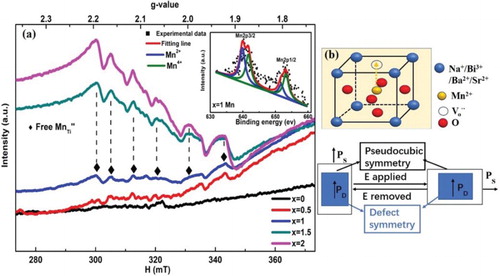
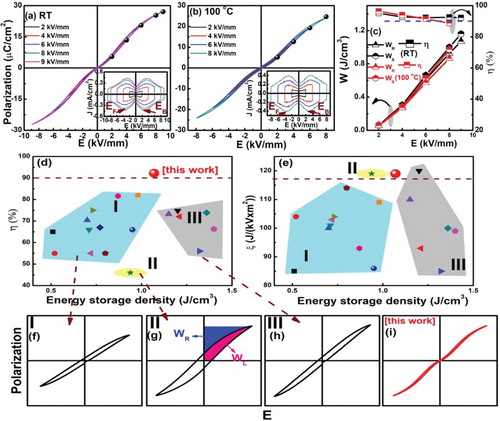
Figure 5. (a and b) P–E hysteresis loops for 1 Mn ceramics under different electric fields with corresponding J–E loops in their insets; (c) the electric field dependence of WR, WS and η at RT and 100°C, respectively. (d and e) Comparison of WR and ξ among previously reported BNT-based ceramics; (f–h) three kinds of P–E loops reported in the literature, the inset of (g) illustrates the definition of WR and WL in the P–E loop and (i) the quasi-hysteresis-free loop discovered in this work.