Figures & data
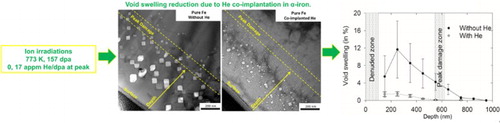
Figure 1. SRIM calculations of displacement damage, helium concentration and injected self-ion concentration depth profile for Fe matrix.
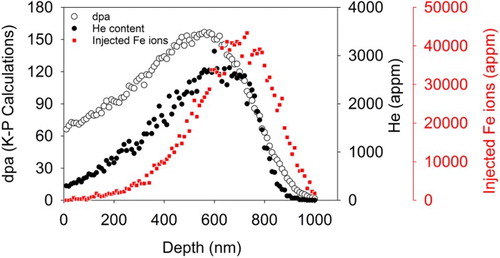
Figure 2. BF TEM images of cavities in α-Fe when (a) helium was co-implanted to 17 appm He/dpa at damage peak and (b) without helium co-implantation. Imaging was performed exactly on (001) zone axis, as evidenced by the diffraction patterns shown as insets. (c), (d). TEM images of depth distribution of cavities with and without helium co-implantation respectively, imaged far away from diffraction conditions. (under-focus = −1136 nm).
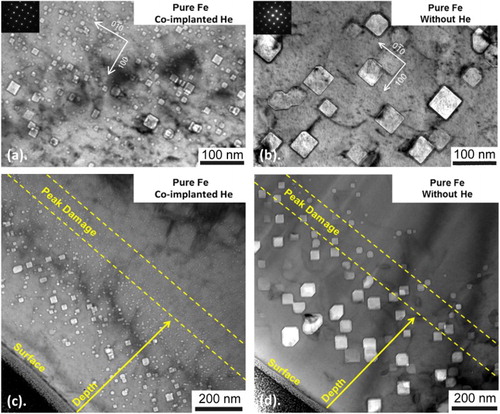
Figure 3. Depth distribution of (a) void swelling (b) average cavity size and (c) number density in α-Fe irradiated at 773 K, without and with co-implantation of helium.
Figure 4. Depth variation of cavity sink strength in the irradiated α-Fe.