Figures & data
Figure 1. EBSD micrographs of (a) CG-CCA and (b) magnified view of CG CCA. (c) hi-HGS CCA, and (d) magnified view of completely recrystallized fine grains. (e) BSE image of hi-HGS showing B2 precipitates and (f) TEM image showing B2 precipitates of plate shape (red arrow), globular shape (green arrows) and the diffraction pattern in the inset.
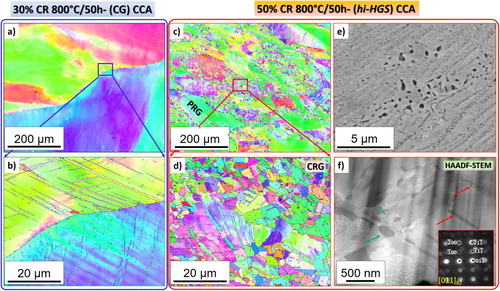
Figure 2. (a) Engineering and true stress-strain curves at an initial strain rate of 10−3 s−1. (b) Work-hardening rate and true stress curves as a function of true strain.
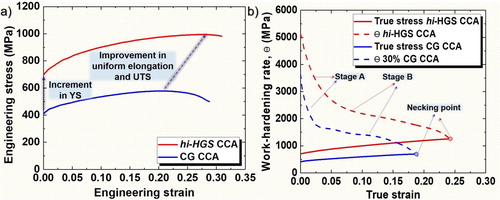
Table 1. Tensile properties of hi-HGS and CG CCA in plastic regime.
Figure 3. (a) Loading-unloading-reloading (LUR) curves of hi-HGS and CG CCAs, (b) measured hysteresis loop for hi-HGS and CG CCAs showing UYP and RYP, (c) back stress and effective stress values of hi-HGS and CG CCAs, and (d) comparison of back stress to YS ratio with literature data.
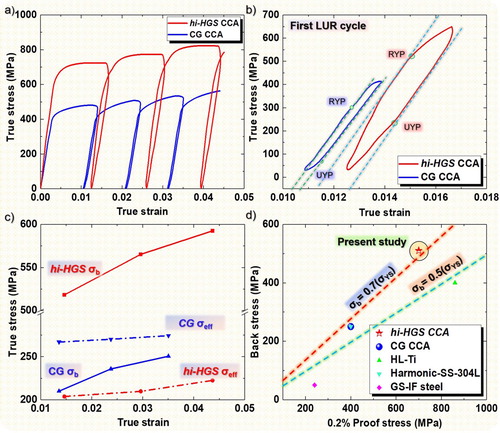
Figure 4. Microstructural evolution during deformation displayed via Kernel average misorientation (KAM) micrographs of hi-HGS (a) at zero stress, (b) just below yield point, and (c) at UTS. (d-f) Microstructural evolution of CG CCA during deformation.
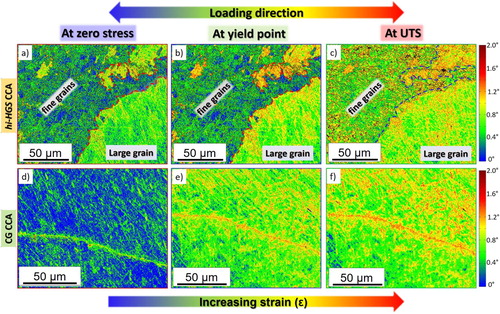
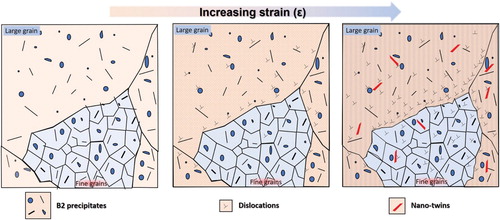
Figure 5. Schematic depicting the microstructure of hi-HGS and its deformation behavior.