
Figures & data

Figure 1. (a) θ–2θ X-ray diffractograms of 40.3 nm (red) and 156 nm (black) thick (Cr0.5Mn0.5)2GaC films. (b–e) Scanning electron microscopy images of (Cr0.5Mn0.5)2GaC film surfaces for film thickness d = 12.5, 20.8, 40.3 and 156 nm.
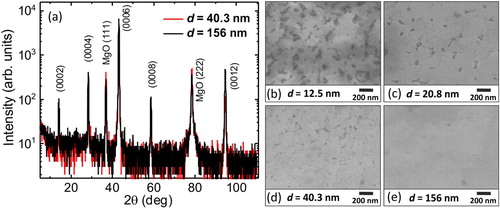
Figure 2. (a) FMR spectra of (Cr0.5Mn0.5)2GaC films with different thickness measured at the temperature of T = 110 K. The ‘noisy’ features from 0.31 to 0.37 T are electron paramagnetic resonance (EPR) signals from impurities in the MgO substrate. (b) Temperature dependence of the FMR field for different thicknesses of (Cr0.5Mn0.5)2GaC films, solid lines are a guide to the eye.
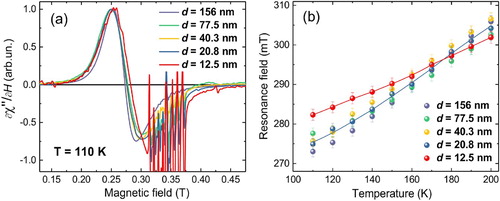
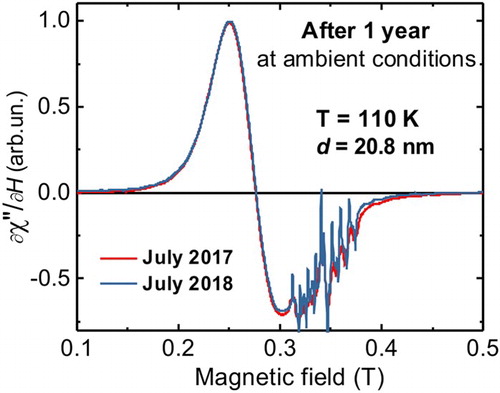
Figure 3. FMR spectra of the (Cr0.5Mn0.5)2GaC film with the thickness of d = 20.8 nm recorded in the time interval of 1 year.
Supplemental material