Figures & data
Figure 1. Microstructure and strain rate jump tests on the flash sintered 3YSZ. (a–b) Bright field TEM micrographs of the flash sintered 3YSZ showing (a) ultrafine grains and (b) an array of preexisting dislocations. (c–e) SEM snapshots of the pillars tested at 450°C, 550°C, and 650°C at 0, 3%, 6%, and final strains (11–12%). Several cracks propagated from the top surface of the pillar. Crack length and density reduce as test temperature rises.
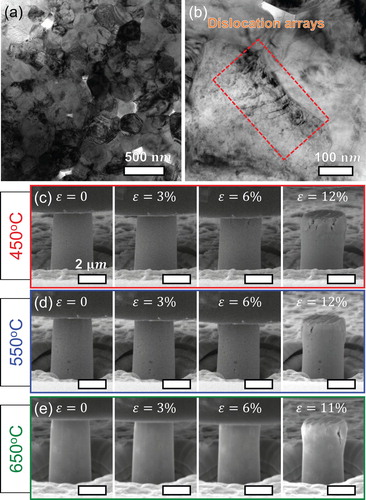
Figure 2. Stress–strain curves for strain rate jump tests on the flash sintered 3YSZ at 450, 550, and 650°C. Stress–strain curves for three strain rate jump tests at (a) 450°C, (b) 550°C, and (c) 650°C. Strain rate of 5 × 10⁻⁴ s−1 was employed in the elastic region. Strain rates of 3 × 10⁻³ s−1, 1 × 10⁻² s−1, 5 × 10⁻² s−1, and 3 × 10⁻¹ s−1 were utilized in the plastic region to obtain flow stresses at each temperature. The flow stresses increase with increasing strain rate and decreasing temperature.
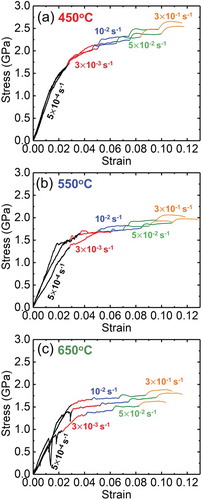
Figure 3. The determination of the threshold stress for the flash sintered 3YSZ at 450°C, 550°C, and 650°C. (a) The determination of the threshold stress with a stress exponent of 1. The actual data points deviate significantly from the linear regression lines as indicated by the curved dash lines. (b) The determination of the threshold stress with a stress exponent of 2. The actual data shows better linear fit than those with a stress exponent of 1, but still deviates from the linear regression lines by exhibiting positive upward curvature. (c) The determination of the threshold stress with a stress exponent of 7. The linear regression lines match well with the actual data. The extrapolation of the linear line to zero strain rate describes the threshold stress.
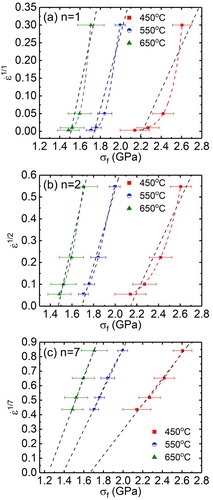
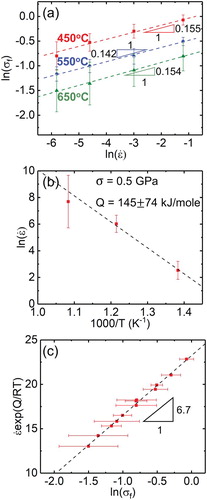
Figure 4. Corrected data processing from strain rate jump tests on the flash sintered 3YSZ at 450°C, 550°C, and 650°C in consideration of the presence of the threshold stress. (a) The corrected flow stress as a function of strain rates at each temperature. The strain rate sensitivities after the correction increase to 0.15. (b) Temperature dependence of strain rate at a flow stress of 500 MPa. The activation energy is estimated to be 145 ± 74 kJ/mole. (c) The corrected flow stress versus the normalized strain rate. The data correction with an imposed stress exponent of 7 returns the stress exponent of 6.7.