Figures & data
Figure 1. Perfect dislocation emissions from a Cu/brass interface. (a) A Cu grain–brass interface delineated by four purple dots. The blue arrow indicates a stress concentration spot. (b) A perfect dislocation (marked by the blue arrow) emitted from the interface at the stress concentration spot. (c) The dislocation reached the sample surface and broke to two segments as indicated by two blue arrows.
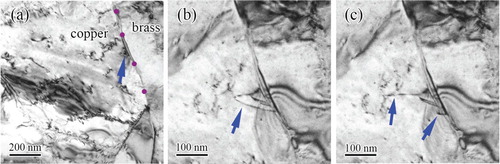
Figure 2. Twin nucleation and growth from the domain interface and twin-dislocation interactions. (a) A stacking fault nucleated from the interface. (b) A three-layer deformation twin (green arrow) changes to two layers near the growth end (blue arrow). (c) A perfect dislocation interacting with the twin (orange arrow). (d) Detwinning caused by a dislocation (blue arrow). (e) Second twin from the interface and dislocations emitted from a Fran-Read source between the two twins. (f) Strain field near the interface.
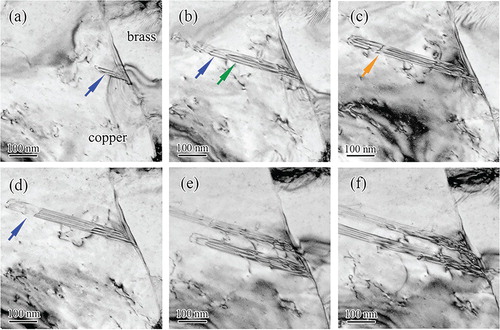
Figure 3. Dynamic nucleation and deactivation of Frank–Read sources. (a) A Frank–Read source produced five dislocations piling-up against the interface, (b) The deactivation of the dislocation source; (c) Another Frank–Read source was activated and emitted a dislocation loop. (d) The dislocation loop was broken at the sample surface.
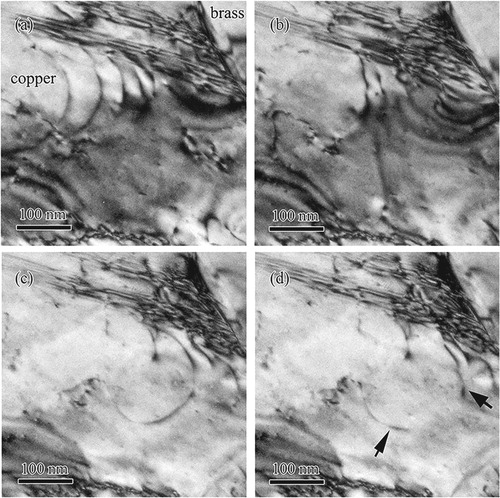
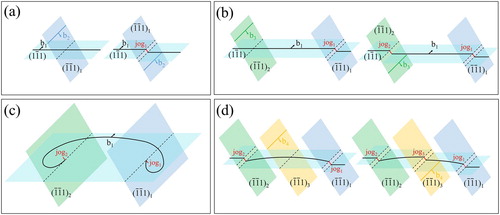
Figure 4. Schematic diagram of dynamic nature of the Frank–Read source. (a) Intersection of two dislocations gliding on different slip planes, (b) Two pinning jogs formed along a gliding dislocation, (c) A Frank–Read source is generated to emit dislocations under the local stress, and (d) The Frank–Read source is deactivated by a new jog formed between the two pinning jogs.