Figures & data
Figure 1 Plastic deformation accommodation mechanisms in the flow of metallic glasses (MGs). On the potential energy landscape, the flow of MGs can be understood as a stress-driven α relaxation process (as indicated by the red dashed arrow). The α relaxation is conceived as composed of Johari–Goldstein (JG) relaxations (as indicated by the green dashed arrows). In the creep stage of nanoindentation, the MG beneath the indenter is post-yield and close to the transition state (τc is the yield stress). Thus, the deformation in the creep stage of nanoindentation reveals the plastic deformation accommodation character of MGs and can be considered as stress driven JG relaxations.
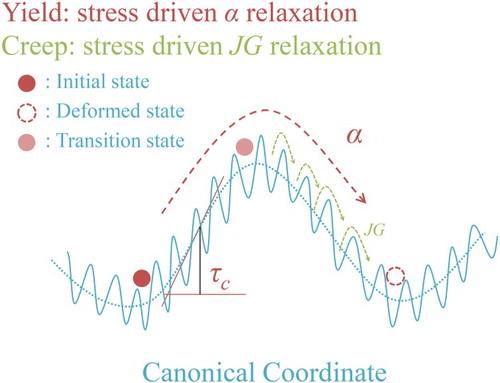
Figure 2 The Johari–Goldstein (JG) relaxation of 4 La(TM)Al metallic glasses(MGs), TM = Ni, Co, Cu, CuNi: the loss modulus spectroscopies of the LaNiAl (a) and LaCoAl (b) MGs with pronounced JG relaxation, and of the LaCuAl (c) and LaCuNiAl (d) MGs without pronounced JG relaxation.
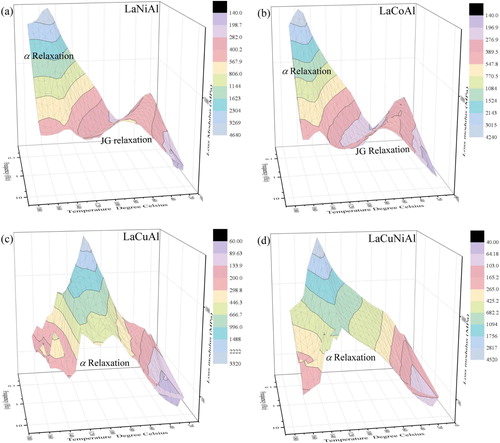
Figure 3 The load–displacement curves of the 4 La(TM)Al metallic glasses (MGs), TM = Ni, Co, Cu, CuNi: (a) LaNiAl, (b) LaCoAl, (c) LaCuAl, and (d) LaCuNiAl. The serrations of the four La (TM)Al MGs: (e) LaNiAl, (f) LaCoAl, (g) LaCuAl, and (h) LaCuNiAl. Upon increased loading rate, increasing serrations can be found for the LaNiAl and LaCoAl MGs, while decreasing serrations can be observed for the LaCuAl and LaCuNiAl MGs.
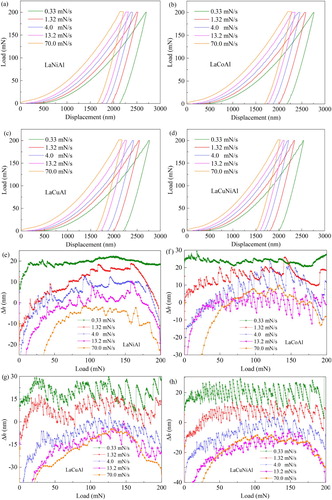
Figure 4 Creep displacement vs. time curves of the 4 La(TM)Al metallic glasses (MGs), TM = Ni, Co, Cu, CuNi, in the creep stage of nanoindentation with the maximum load reached at different loading rates: (a) LaNiAl, (b) LaCoAl, (c) LaCuAl, and (d) LaCuNiAl. Solid lines are the Kohlrausch–Williams–Watts (KWW) equation fits. Stretched exponent (e) and relaxation time (f) of the La(TM)Al MGs derived from the KWW equation fits. The relaxation time of Ni and Co alloyed MGs (g) nearly remains a constant, while the relaxation time of the Cu and CuNi alloyed MGs (h) display a clear decrease, under increasing loading rate.
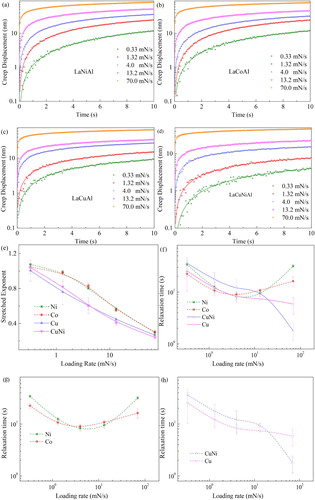
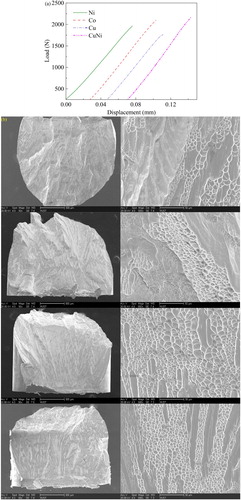
Figure 5 Typical compression curves of the 4 La(TM)Al metallic glasses (MGs), TM = Ni, Co, Cu, CuNi, (a) and the typical fractography (b), from top to bottom: TM = Ni, Co, Cu, CuNi.