Figures & data
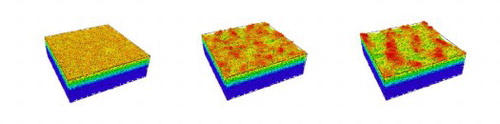
Figure 1. Evolution of the initially flat surface ((a) 9000 (fluence: ), (b) 27000 (
) and (c) 50000 (
) impacts) under random impact 30 eV-Ar
at
.
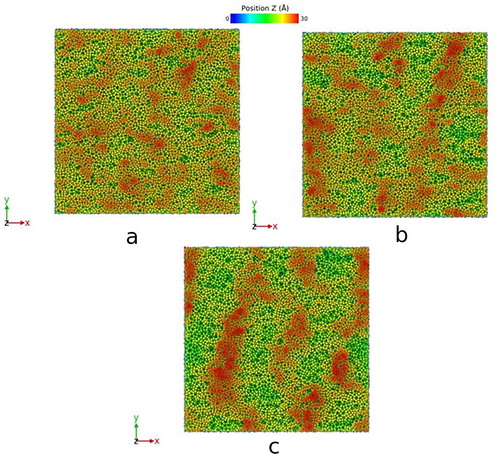
Figure 2. (a) Displacement vectors (located at the final position and shortened by a factor of 1/5 for clearer observation) from the initial configuration. The black rectangle represents a closer view of the displacement vectors (shortened by a factor of 1/2) in one of the ridge areas (a 1.5 nm-thickness slice in the y-direction). (b) Evolution of the different components of the displacement vectors δ (on the left vertical axis) and only negative contribution in the x-direction (on the right vertical axis) as a function of the number of incoming ions.
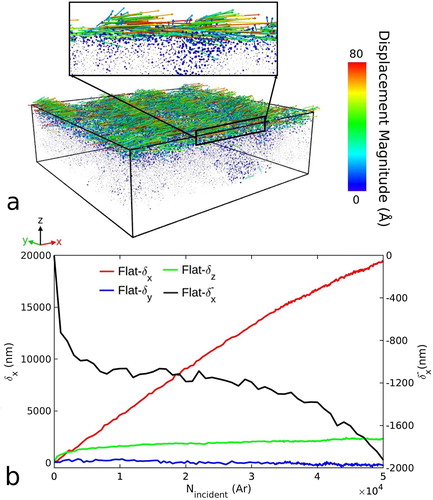
Figure 3. (a) Several initial mounds (colored circles) after 18900 Ar impacts (fluence:
) that eventually meet in a final ridge (b) at 45540 Ar
impacts (
).
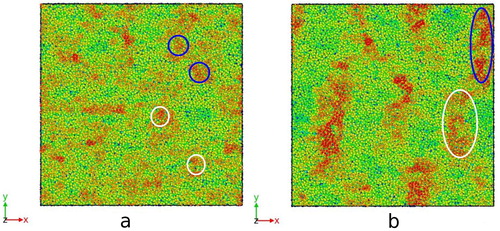
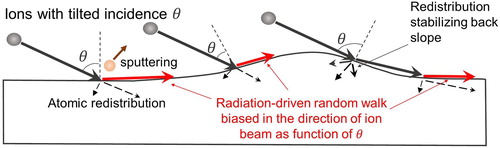
Figure 4. Illustration of the biased surface atom diffusion induced by ion beam after initial random roughening of the surfaced based on observations from the simulations.