
Figures & data
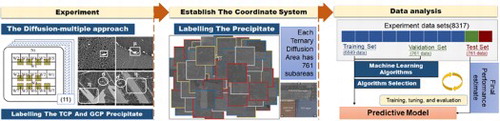
Figure 1. Schematic workflow of the proposed method.
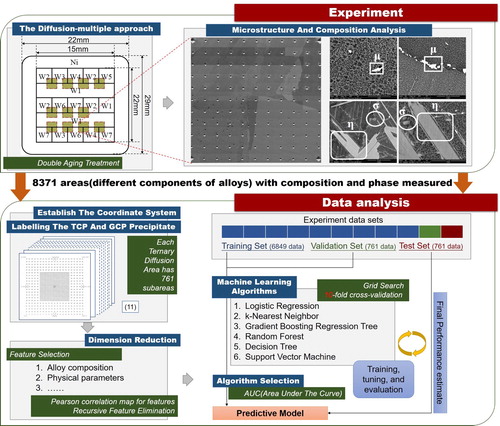
Table 1. Measured composition of multicomponent alloys in wt.%.
Figure 2. (A-G) SEM images of W1-W7 alloys; (H, I) the magnified images of σ, µ and η phases, respectively; (J, K, L) the electron backscattered diffraction Kikuchi patterns of µ, σ, and η, respectively; (M) labeled and (N) montaged SEM images of NiX-6W-4Nb diffusion triple.
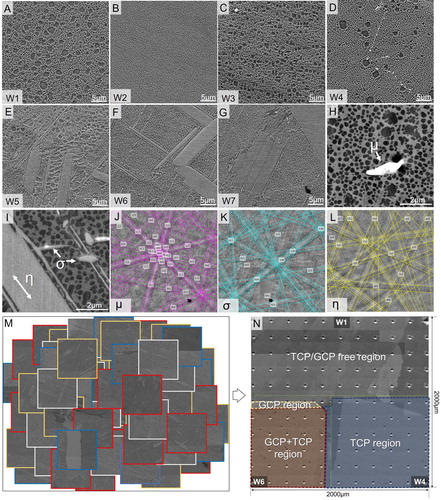
Figure 3. Pearson correlation map for features of (A) alloy composition, and (B) 12 physical parameters.
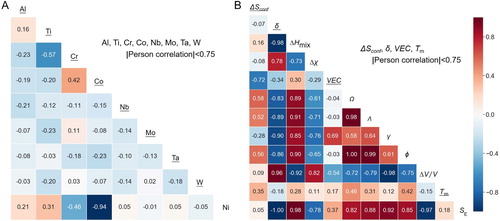
Table 2. Physic parameters.
Figure 4. Recursive feature elimination results showing (A) the feature importance and (B) AUC value of TCP phases; (C) the feature importance and (D) AUC value of GCP illustrating predicted by models with different feature sets; the SHAP values of (E) TCP and (F) GCP.
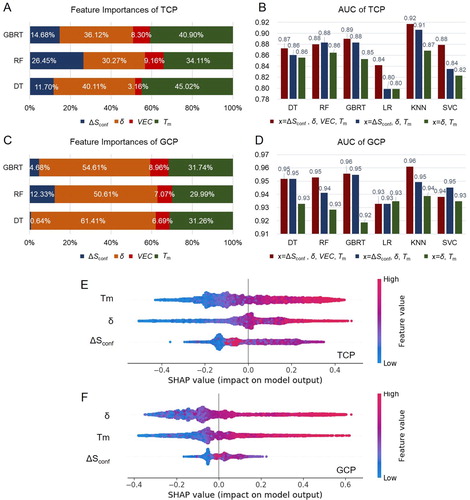
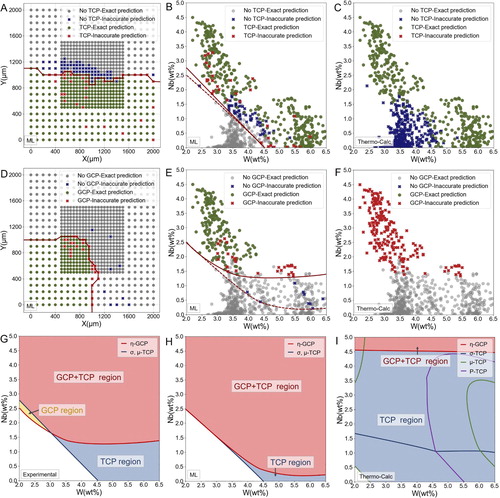
Figure 5. The predicted results showing (A) the distribution and (B) ZPF line of TCP phases by ML and (C) Thermo-Calc; (D) the distribution and (E) ZPF line of GGP phases by ML and (F) Thermo-Calc; and the phase diagram by (G) experimental, (H) ML and (I) Thermo-Calc in NiX-6W-4Nb diffusion triple.