
Figures & data
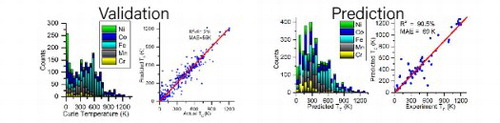
Figure 1. Distribution of TC. (a) Histogram of TC for 1749 FM materials in the database. (b) Distribution of the elements for compounds in the FM database.
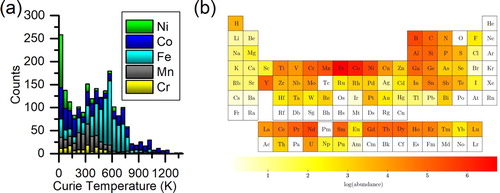
Figure 2. Performance of the classification model. (a): Confusion matrix of FM and AFM classification test set (b): Line graph represents the accuracy, precision, recall and F1 score of the 10-folder cross validation of classification data, and the pie chart denotes the most important features in classification model (cf. Supplementary for detailed explanation).
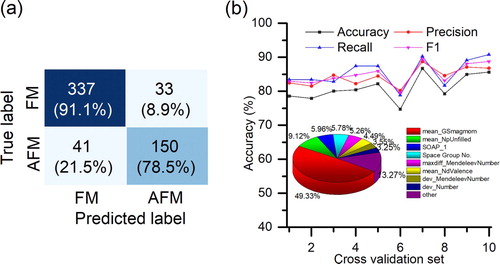
Figure 3. Regression model performance and feature importance. (a) Predicted vs. experimental TC for test set. (b) Line graph represents the MAE and R2 score of the 10-folder cross validation of our database, and the pie chart denotes the most important features in two-step regression model (cf. Supplementary for detailed explanation).
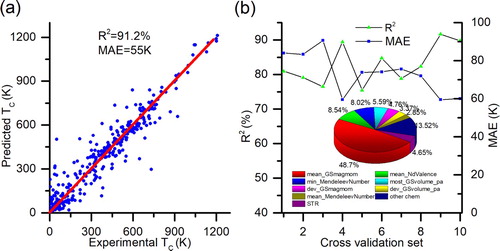
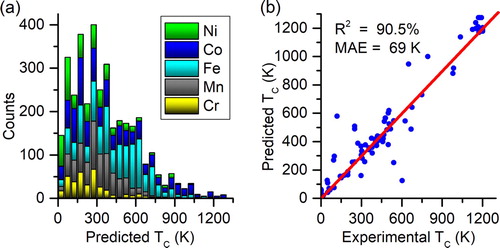
Figure 4. TC prediction. (a) Histogram of predicted TC for 3002 FM materials in the database. (b) Scatter plot of predicted vs. experimental TC for 85 compounds with experimental TC.
Supplemental Material
Download MS Word (7.2 MB)Data availability statement
The data that support the findings of this study are available from the corresponding author upon reasonable request.